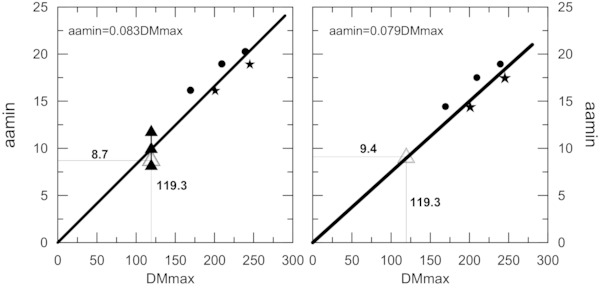
Fig. 3

Download original image
Geomagnetic index at minimum, aamin, vs. observed maximum amplitude of the dipolar field strength, DMmax. The ordinates of the stars and dots are the observations of DMmax as deduced from Mount Wilson and Wilcox solar observatories data, respectively. The abscissae are the yearly values of the standard aa index (left-hand panel) and the homogenized data from Lockwood (2009, priv. comm.). The filled triangles in the left-hand panel are a measure for the prediction of aamin #24 as derived from the regression line and the value of DMmax for cycle 24 (De Jager & Duhau 2009) and the open triangle is the observed value. The open triangle in the right-hand panel is the value of aamin obtained from the corresponding regression line. This diagram proves that aamin is a suitable proxy for the polar field flux.
Current usage metrics show cumulative count of Article Views (full-text article views including HTML views, PDF and ePub downloads, according to the available data) and Abstracts Views on Vision4Press platform.
Data correspond to usage on the plateform after 2015. The current usage metrics is available 48-96 hours after online publication and is updated daily on week days.
Initial download of the metrics may take a while.


