Fig. 6
Download original image
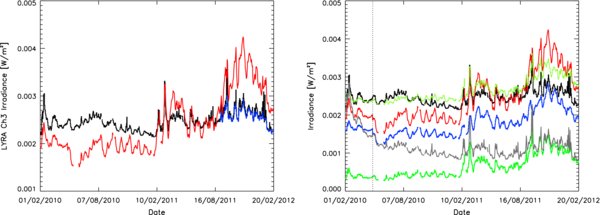
Daily value of LYRA channel 3 irradiance. Left panel: daily channel 3 irradiance (black) compared with the simulated response using TIMED/SEE and SDO/EVE (in red). The blue line shows the channel 3 daily minimum value. Right panel: same as in the left panel for the black and red lines. Dark blue and green lines indicate the EUV and SXR contributions to the simulated channel 3, respectively. The thin light green line shows the SXR contribution scaled to the LYRA channel 3 level (by adding 2.10−3 W m−2). The thick gray line shows LYRA channel 3 uncorrected for degradation. The start date for the use of the EVE data is indicated by the dotted vertical line.
Current usage metrics show cumulative count of Article Views (full-text article views including HTML views, PDF and ePub downloads, according to the available data) and Abstracts Views on Vision4Press platform.
Data correspond to usage on the plateform after 2015. The current usage metrics is available 48-96 hours after online publication and is updated daily on week days.
Initial download of the metrics may take a while.