Fig. 6.
Download original image
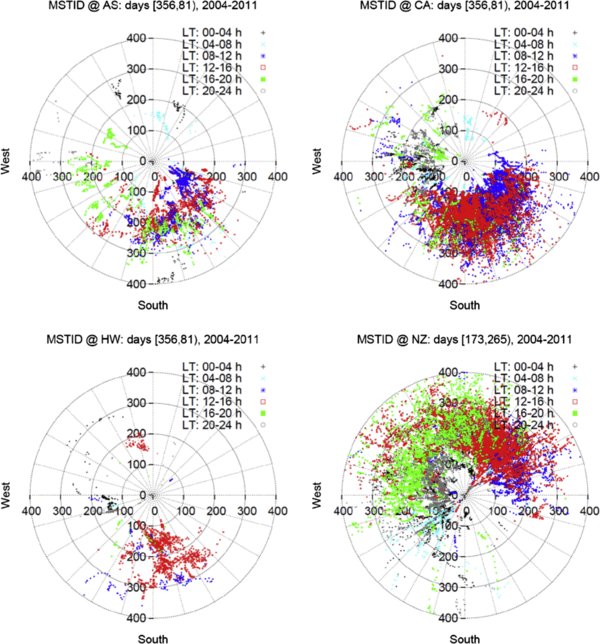
Polar plots representing MSTID velocities (m/s) and azimuths for local fall, for the four selected networks, AS (top-left), CA (top-right), HW (bottom-left) and NZ (bottom-right), in the analysed period. Colour code: black for LT 00–04 h, light blue for LT 04–08 h, dark blue for LT 08–12 h, red for LT 12–16 h, green for LT 16–20 h and grey for LT 20–24 h (Figure extracted from Hernandez-Pajares et al. 2012).
Current usage metrics show cumulative count of Article Views (full-text article views including HTML views, PDF and ePub downloads, according to the available data) and Abstracts Views on Vision4Press platform.
Data correspond to usage on the plateform after 2015. The current usage metrics is available 48-96 hours after online publication and is updated daily on week days.
Initial download of the metrics may take a while.