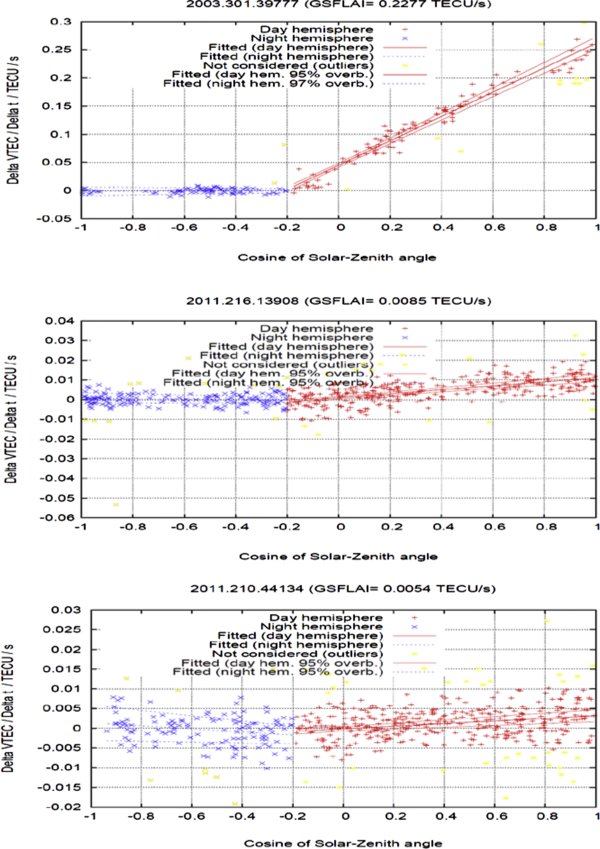
Fig. 8.
Download original image
De-trended VTEC rate versus cosine of solar zenith angle, for three representative solar flares, with decreasing intensity; from top to bottom: day 301 of 2003, precursor flare of Halloween storm (X17.2 flare, day 301, 2003, 39777 s of GPS time), M9.3 flare, day 216 of 2011 (13908 s of GPS time) and C3.9 flare, day 210 of 2011 (44134 s of GPS time). The corresponding regression lines and 1-sigma boundaries are given.
Current usage metrics show cumulative count of Article Views (full-text article views including HTML views, PDF and ePub downloads, according to the available data) and Abstracts Views on Vision4Press platform.
Data correspond to usage on the plateform after 2015. The current usage metrics is available 48-96 hours after online publication and is updated daily on week days.
Initial download of the metrics may take a while.