Fig. 5.
Download original image
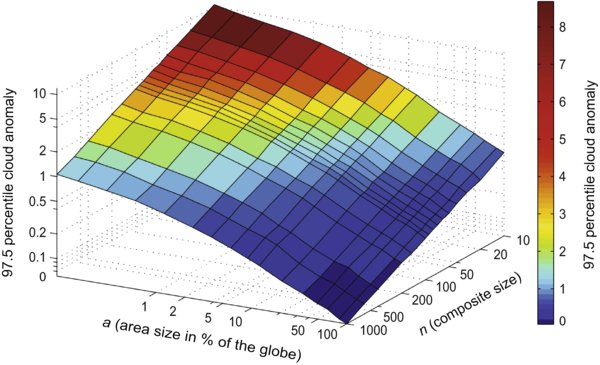
The relationship between increasing sample area (as a percentage of global area: x-axis, denoted by a) and number of events in a composite (z-axis, denoted by n) on noise levels indicated by the 97.5 percentile mean cloud fraction anomalies (%, y-axis) within composites. These values constitute the upper p = 0.05 confidence interval. Each data point is calculated from 10,000 Monte Carlo (MC) simulations from cloud cover anomaly data (21-day running mean subtracted) using PDFs. All axes shown are logarithmic.
Current usage metrics show cumulative count of Article Views (full-text article views including HTML views, PDF and ePub downloads, according to the available data) and Abstracts Views on Vision4Press platform.
Data correspond to usage on the plateform after 2015. The current usage metrics is available 48-96 hours after online publication and is updated daily on week days.
Initial download of the metrics may take a while.