Open Access
Fig. 6.
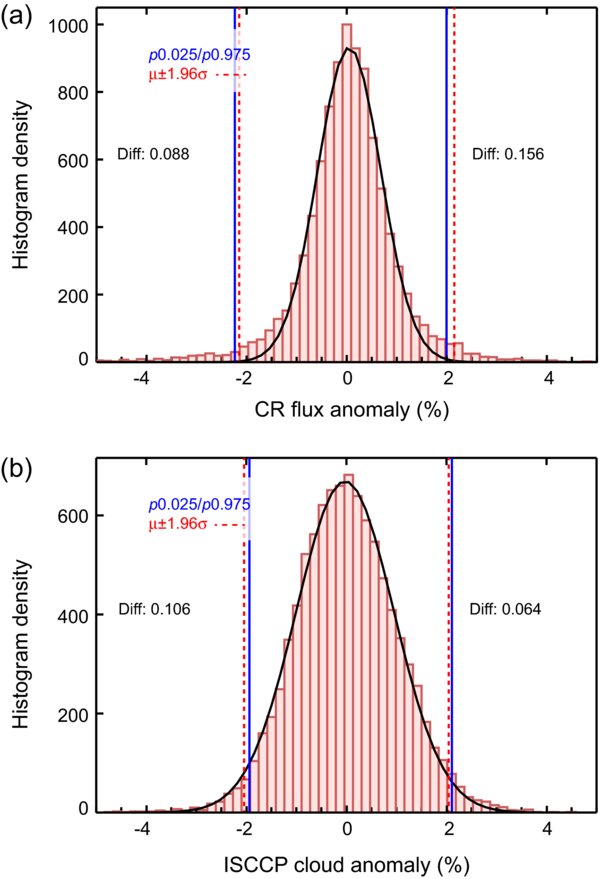
Download original image
Distribution of daily anomalies for the entire 1983–2010 data period for: (a) cosmic ray flux (%), and; (b) cloud cover (%) data. For comparison an idealized Gaussian distribution is shown on the black lines. The mean ±1.96σ, and 2.5/97.5th percentile values are displayed on the red dashed and blue solid lines respectively.
Current usage metrics show cumulative count of Article Views (full-text article views including HTML views, PDF and ePub downloads, according to the available data) and Abstracts Views on Vision4Press platform.
Data correspond to usage on the plateform after 2015. The current usage metrics is available 48-96 hours after online publication and is updated daily on week days.
Initial download of the metrics may take a while.