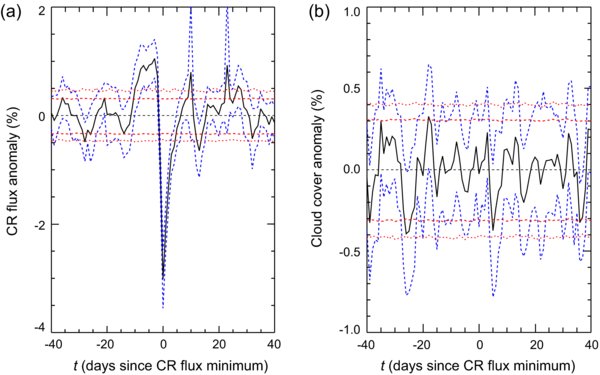
Fig. 8.
Download original image
Composites of (n = 44) Forbush decrease events over a t ±40 day period not coincident within a t ±7 day period of GLEs from 1983 to 1995 for: a) the CR flux (%), and b) cloud cover (%). The mean anomalies (solid black lines) are plotted together with the ±1.96 SEM values (blue dashed lines) for each of the t ±40 days of the composite. Based on PDFs of 10,000 MC simulations at each t value two-tailed confidence intervals are calculated at the p = 0.05 and p = 0.01 levels (dashed and dotted red lines respectively).
Current usage metrics show cumulative count of Article Views (full-text article views including HTML views, PDF and ePub downloads, according to the available data) and Abstracts Views on Vision4Press platform.
Data correspond to usage on the plateform after 2015. The current usage metrics is available 48-96 hours after online publication and is updated daily on week days.
Initial download of the metrics may take a while.