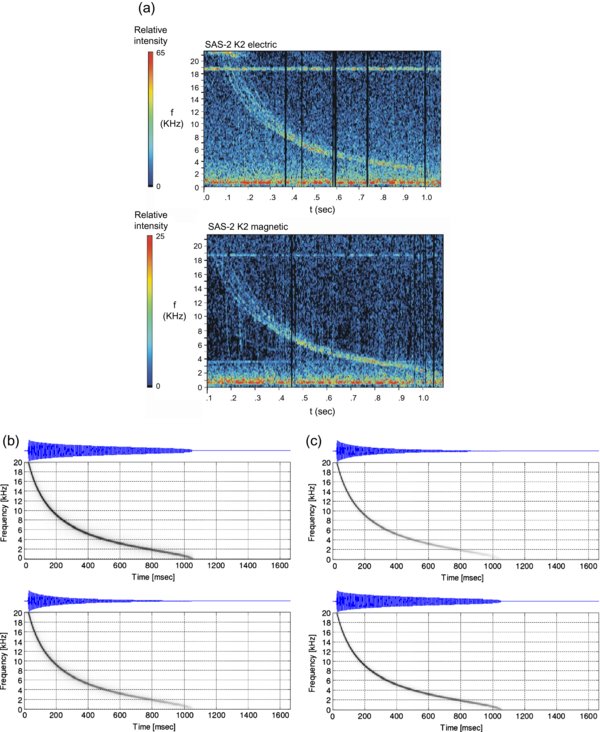
Fig. 1.
Download original image
(a) FFT pattern of a ducted whistler, measured on board of Compass-2 satellite on 28.02.2007 07:32 UT by the SAS2-K2 instrument. Logarithmic power spectrum of electric and magnetic field components are displayed in relative scale, (b) the FFT patterns of the computed (UWB modeled) theoretical whistler components, propagating between two layers of inhomogeneities, the E y (upper panel) and E z (lower panel) components, and (c) the H y (upper panel) and H z (lower panel) components. The y direction is orthogonal to the direction of propagation and to the layers of inhomogeneities; the z direction is orthogonal to the direction of propagation and parallel with the layers of inhomogeneities. Above the FFT pattern of the modeled UWB signals the computed time functions of the modeled field strengths are presented (Ferencz et al. 2009).
Current usage metrics show cumulative count of Article Views (full-text article views including HTML views, PDF and ePub downloads, according to the available data) and Abstracts Views on Vision4Press platform.
Data correspond to usage on the plateform after 2015. The current usage metrics is available 48-96 hours after online publication and is updated daily on week days.
Initial download of the metrics may take a while.