Figure 2.
Download original image
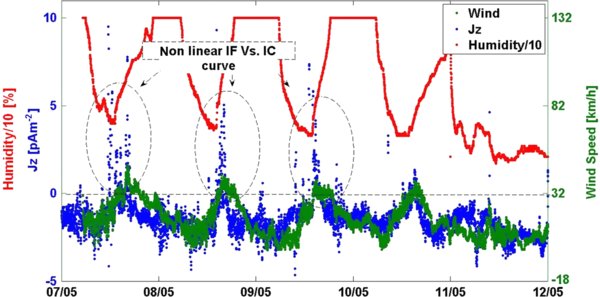
A week of data of Jz values (blue points) from 7 May 2011 to 12 May 2011. Daily variations are superimposed on the changes in wind speed (green) and relative humidity (red). Dashed horizontal line indicates zero current.
Current usage metrics show cumulative count of Article Views (full-text article views including HTML views, PDF and ePub downloads, according to the available data) and Abstracts Views on Vision4Press platform.
Data correspond to usage on the plateform after 2015. The current usage metrics is available 48-96 hours after online publication and is updated daily on week days.
Initial download of the metrics may take a while.