Figure 4.
Download original image
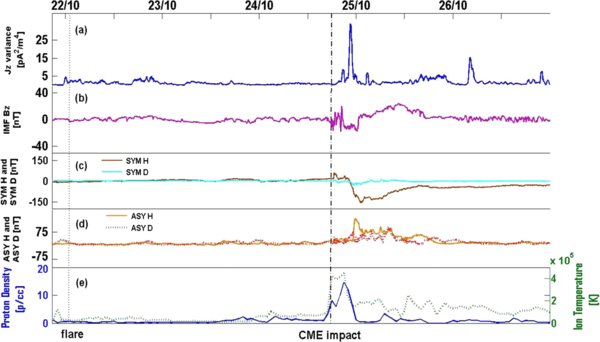
(a) Jz fluctuations measured in MR during 22–27 of October 2011; (b) IMF Bz; (c) The horizontal symmetric geomagnetic disturbance field (SYM H, brown curve) and the orthogonal symmetric geomagnetic disturbance field (SYM D, turquoise curve); (d) The horizontal asymmetric geomagnetic disturbance field (ASY H, orange curve) and the orthogonal asymmetric (ASY D, red dotted curve); (e) ACE SW proton density (blue curve) and SW ion temperature (green dotted curve).
Current usage metrics show cumulative count of Article Views (full-text article views including HTML views, PDF and ePub downloads, according to the available data) and Abstracts Views on Vision4Press platform.
Data correspond to usage on the plateform after 2015. The current usage metrics is available 48-96 hours after online publication and is updated daily on week days.
Initial download of the metrics may take a while.