Fig. 4.
Download original image
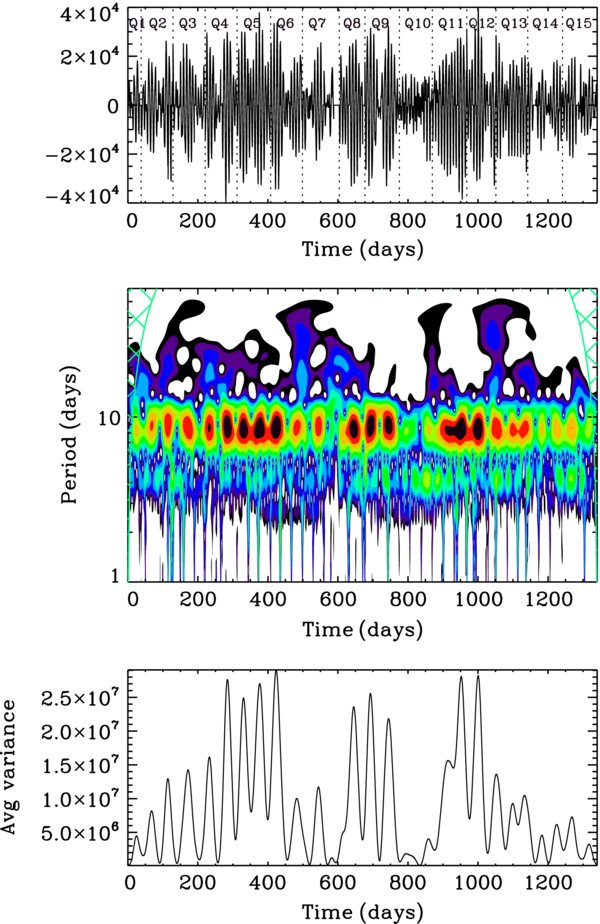
Top: time series of the star KIC 5210507 corrected as described in Section 2. Middle: Wavelet Power Spectrum as a function of time and period. Dark and red colours correspond to high power while blue and purple colours correspond to low power. The green grid corresponds to the cone of influence that delimits the reliable regions of the WPS by taking into account edge effects. Bottom: Scale-average variance obtained by projecting the WPS on the time axis around the rotation period of the star (8.43 days).
Current usage metrics show cumulative count of Article Views (full-text article views including HTML views, PDF and ePub downloads, according to the available data) and Abstracts Views on Vision4Press platform.
Data correspond to usage on the plateform after 2015. The current usage metrics is available 48-96 hours after online publication and is updated daily on week days.
Initial download of the metrics may take a while.