Figure 7.

Download original image
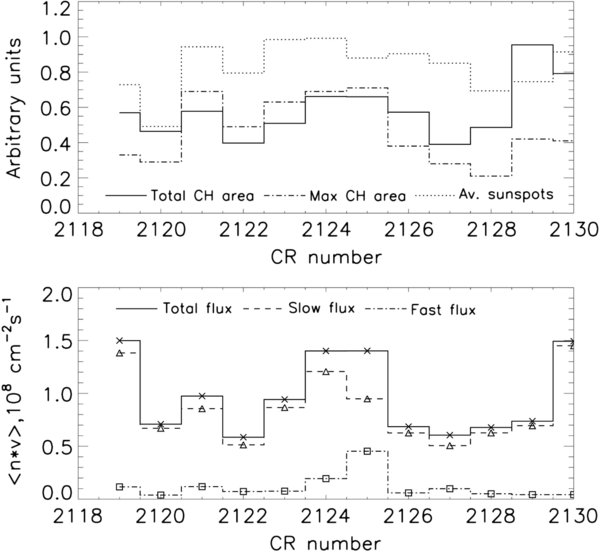
Top panel: variations of the CH areas during CR 2119–2130 (January–November 2012) in arbitrary units. Solid line – the total CH area; dashed-dotted line – the maximum value of the CH area in the current rotation obtained from the SDO/AIA images at 193 Å. Dotted line – the daily sunspots numbers averaged over each rotation (in arbitrary units). Bottom panel: variation of the SW density flux during CR 2119–2130. Solid line with crosses – the total SW density flux; dashed line with triangles – the slow SW density flux (V < 450 km s−1); dashed-dotted line with squares – the fast SW density flux (V > 450 km s−1).
Current usage metrics show cumulative count of Article Views (full-text article views including HTML views, PDF and ePub downloads, according to the available data) and Abstracts Views on Vision4Press platform.
Data correspond to usage on the plateform after 2015. The current usage metrics is available 48-96 hours after online publication and is updated daily on week days.
Initial download of the metrics may take a while.


