Fig. 15.
Download original image
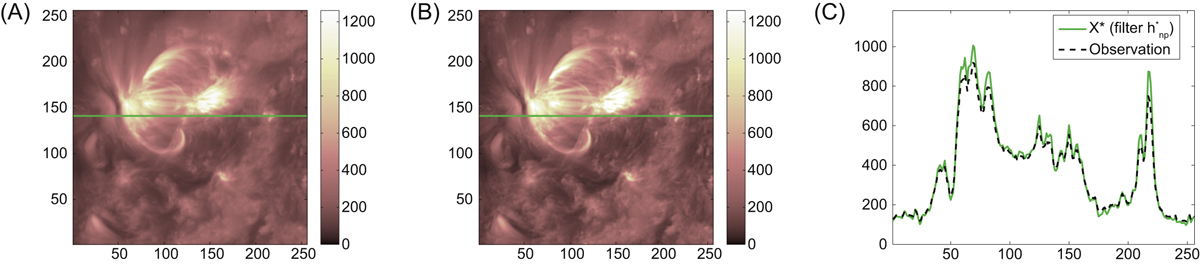
Reconstruction results for a SECCHI/EUVI image containing an active region. The image has been captured at 04:02 UT on February 25th, 2007. Results are shown for the non-parametric filter, i.e., ![]() . (A) Observed image, (B) 2-D reconstruction result, and (C) best viewed in color) 1-D profile along y = 141. Figures (A) and (B) contain a green line indicating the 1-D profiles shown on the right.
. (A) Observed image, (B) 2-D reconstruction result, and (C) best viewed in color) 1-D profile along y = 141. Figures (A) and (B) contain a green line indicating the 1-D profiles shown on the right.
Current usage metrics show cumulative count of Article Views (full-text article views including HTML views, PDF and ePub downloads, according to the available data) and Abstracts Views on Vision4Press platform.
Data correspond to usage on the plateform after 2015. The current usage metrics is available 48-96 hours after online publication and is updated daily on week days.
Initial download of the metrics may take a while.