Fig. 7.
Download original image
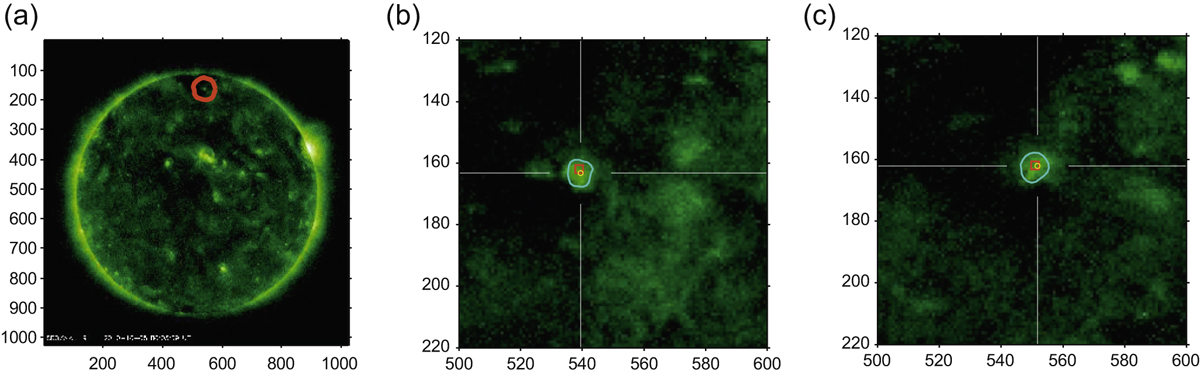
(a) Red contour represents the initial snake on first image (the Sun at 2010-10-05), (b) and (c) cropped view of the tracking process of the selected CBP during time, showing the CBP in frame 1 and frame 37, respectively. The cyan contour is the boundary of the tracked CBP, the red square is the expert’s manual CBP positioning result, and the yellow circle is the PSO-Snake hybrid algorithm’s automated tracking result for CBP’s center of mass.
Current usage metrics show cumulative count of Article Views (full-text article views including HTML views, PDF and ePub downloads, according to the available data) and Abstracts Views on Vision4Press platform.
Data correspond to usage on the plateform after 2015. The current usage metrics is available 48-96 hours after online publication and is updated daily on week days.
Initial download of the metrics may take a while.