Open Access
Fig. 8.
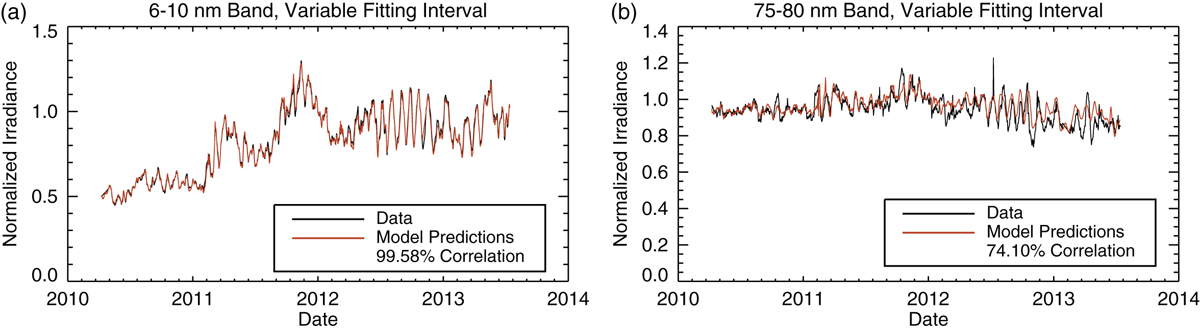
Download original image
Time series for the variable fitting interval model. Reference data uncertainties are a few percent, on the order of the size of the line used to plot. (a) Highest correlation band, (b) lowest correlation band.
Current usage metrics show cumulative count of Article Views (full-text article views including HTML views, PDF and ePub downloads, according to the available data) and Abstracts Views on Vision4Press platform.
Data correspond to usage on the plateform after 2015. The current usage metrics is available 48-96 hours after online publication and is updated daily on week days.
Initial download of the metrics may take a while.