Open Access
Fig. 1.
Download original image
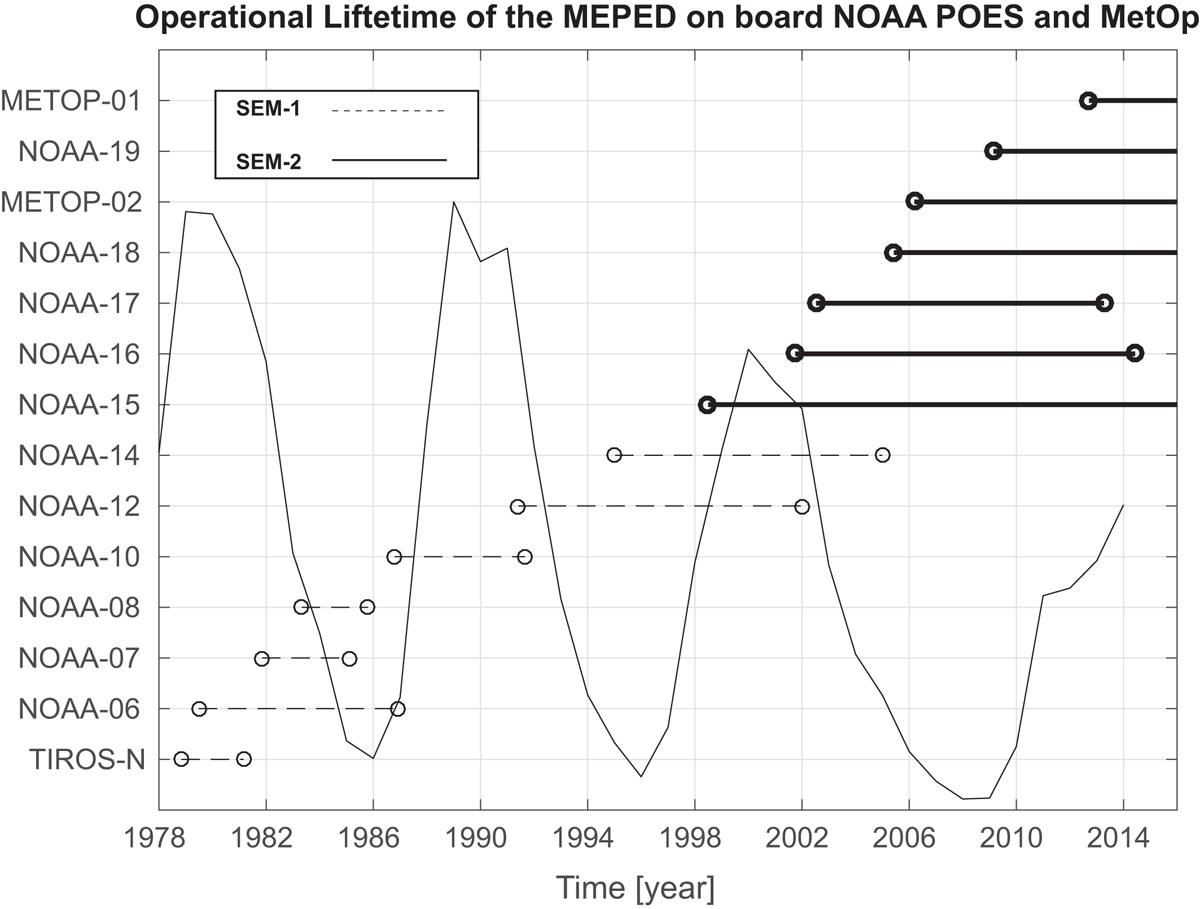
The yearly sunspot number is shown as a solid black curve for reference. The operational lifetimes of the MEPED instrument on the SEM-1 satellites are plotted as dashed lines, and the SEM-2 satellites in thick solid lines.
Current usage metrics show cumulative count of Article Views (full-text article views including HTML views, PDF and ePub downloads, according to the available data) and Abstracts Views on Vision4Press platform.
Data correspond to usage on the plateform after 2015. The current usage metrics is available 48-96 hours after online publication and is updated daily on week days.
Initial download of the metrics may take a while.