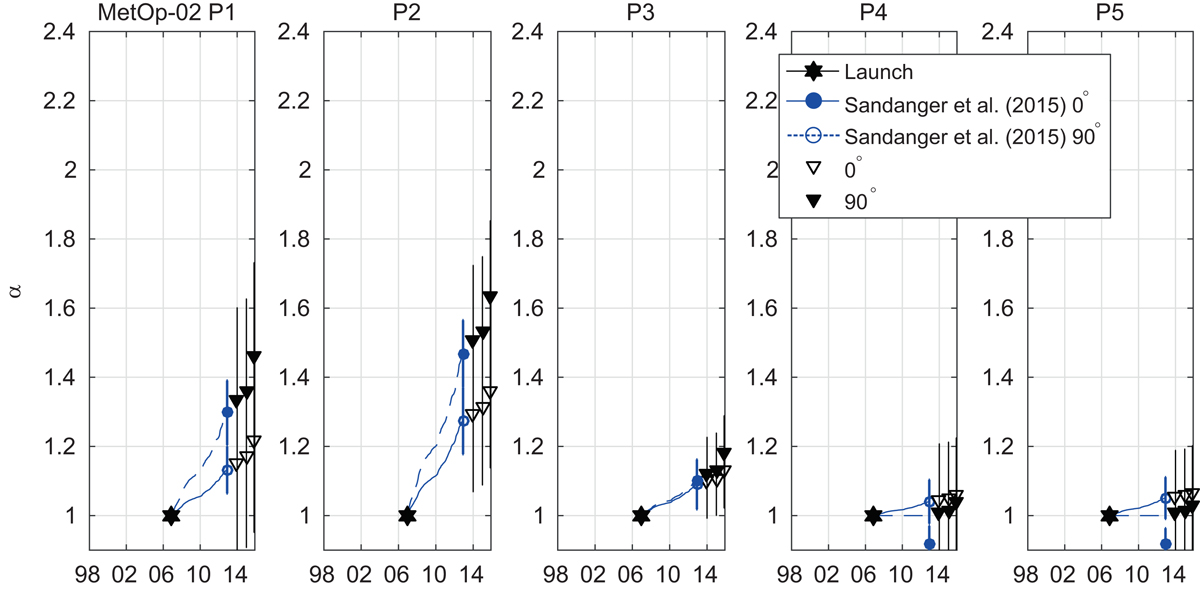
Fig. 12.
Download original image
α factors for MetOp-02 with 12 months in-between, calculated as described in Section 5.3. The 0° detector is shown as open triangles, and the 90° as filled triangles. The estimated error is calculated based on the 95% prediction interval. Factors from Sandanger et al. (2015) are shown as open (0°) and filled (90°) blue circles. Monthly α factors calculated with their method for E > 90 keV are displayed as blue solid (0°) and dashed (90°) lines.
Current usage metrics show cumulative count of Article Views (full-text article views including HTML views, PDF and ePub downloads, according to the available data) and Abstracts Views on Vision4Press platform.
Data correspond to usage on the plateform after 2015. The current usage metrics is available 48-96 hours after online publication and is updated daily on week days.
Initial download of the metrics may take a while.