Fig. 2.
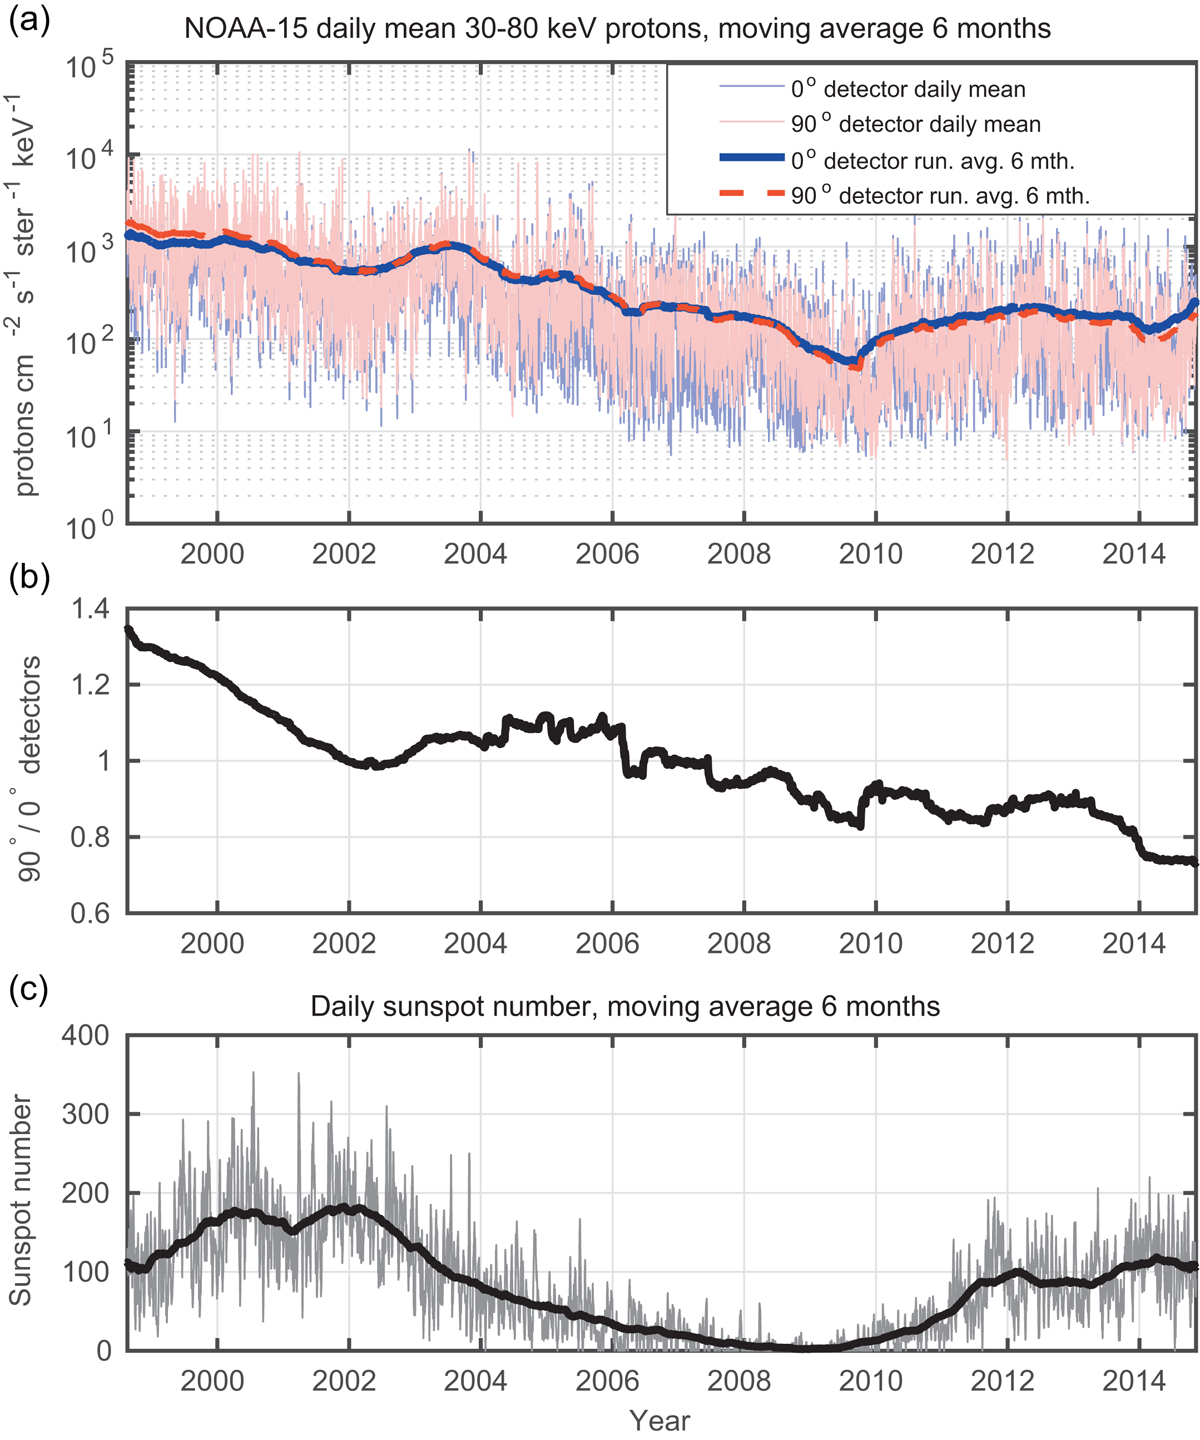
Download original image
(a) Daily mean uncorrected proton differential flux as measured by NOAA-15 P1 channel (30–80 keV) shaded in black. A running mean with a 6-month window is applied and plotted in solid and dashed lines on top. (b) 6-month running mean of 90° detector flux divided by that of the 0° detector. (c) The daily sunspot number shaded in grey. A moving average with a window of 6 months is applied to the data, and plotted in solid line on top. All panels show the period August 1998 to December 2014, each tick on the x-axis shows the 1st of January that year.
Current usage metrics show cumulative count of Article Views (full-text article views including HTML views, PDF and ePub downloads, according to the available data) and Abstracts Views on Vision4Press platform.
Data correspond to usage on the plateform after 2015. The current usage metrics is available 48-96 hours after online publication and is updated daily on week days.
Initial download of the metrics may take a while.