Fig. 5.
Download original image
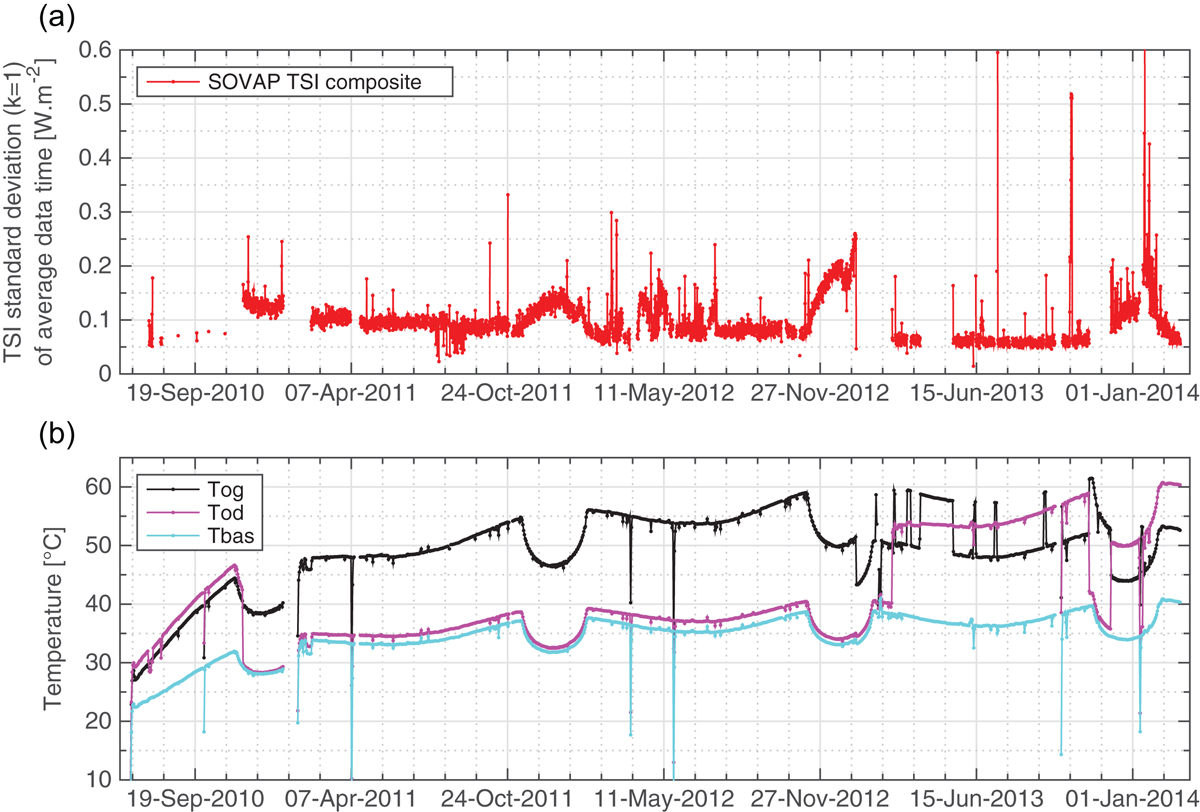
(a) Standard deviation of average data time (6-h high-cadence data points) of the SOVAP TSI composite. (b) Temperature evolution (daily average) of the main components of the SOVAP radiometer. The black curve displays the temperature evolution of the left shutter (Tog). The magenta curve displays the temperature evolution of the right shutter (Tod). The cyan curve displays the temperature evolution of the radiometric core (Tbas).
Current usage metrics show cumulative count of Article Views (full-text article views including HTML views, PDF and ePub downloads, according to the available data) and Abstracts Views on Vision4Press platform.
Data correspond to usage on the plateform after 2015. The current usage metrics is available 48-96 hours after online publication and is updated daily on week days.
Initial download of the metrics may take a while.