Fig. 19.
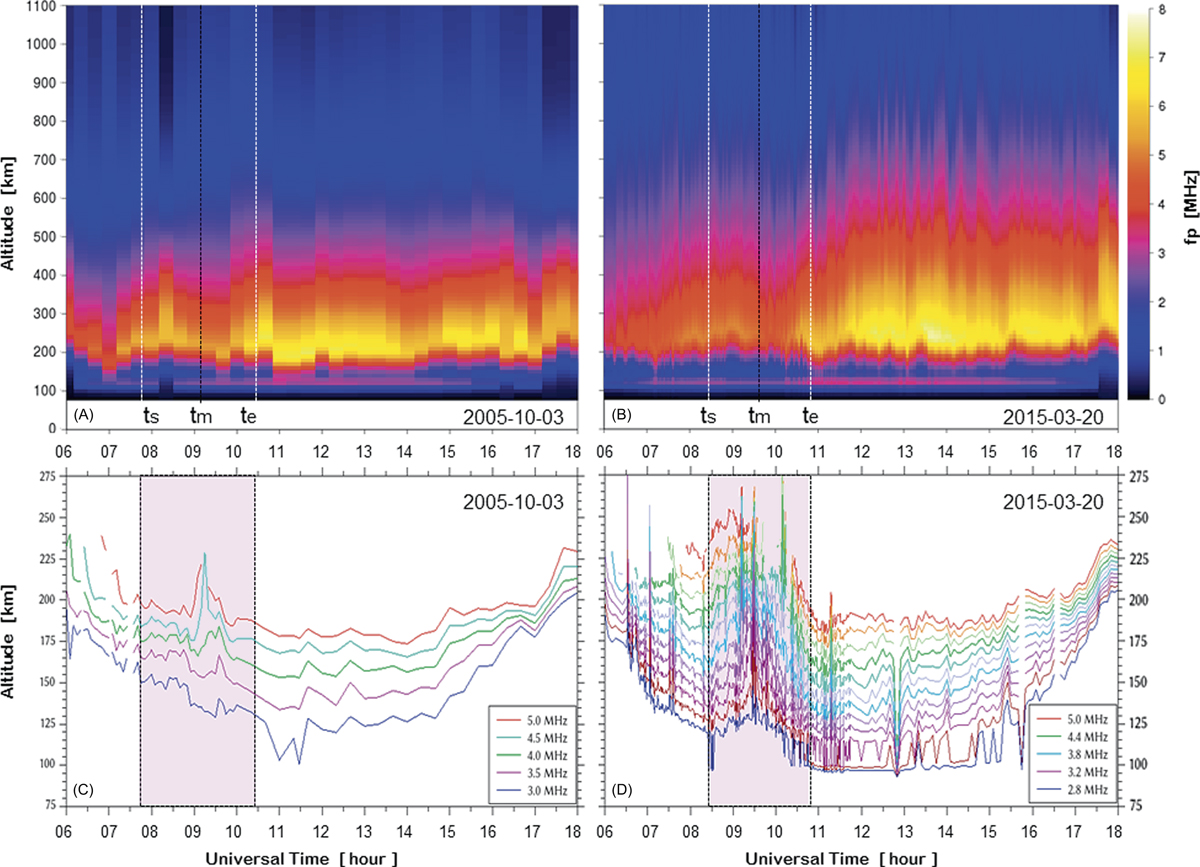
Download original image
Vertical plasma density distribution (A, B) and true-height contours (C, D) over Dourbes during the eclipses of 3 October 2005 (A, C) and 20 March 2015 (B, D). The true-height contours, displayed for frequencies ranging from 2.8 MHz (bottom curve) up to 5.0 MHz (top curve), are obtained from Digisonde measurements. The shadings indicate the eclipse periods. The time resolution is 15 min for the 2005 eclipse and 5 min for the 2015 eclipse, except between 06:30 UT and 11:30 UT on 20 March 2015 when the resolution is 30 s.
Current usage metrics show cumulative count of Article Views (full-text article views including HTML views, PDF and ePub downloads, according to the available data) and Abstracts Views on Vision4Press platform.
Data correspond to usage on the plateform after 2015. The current usage metrics is available 48-96 hours after online publication and is updated daily on week days.
Initial download of the metrics may take a while.