Fig. 3
Download original image
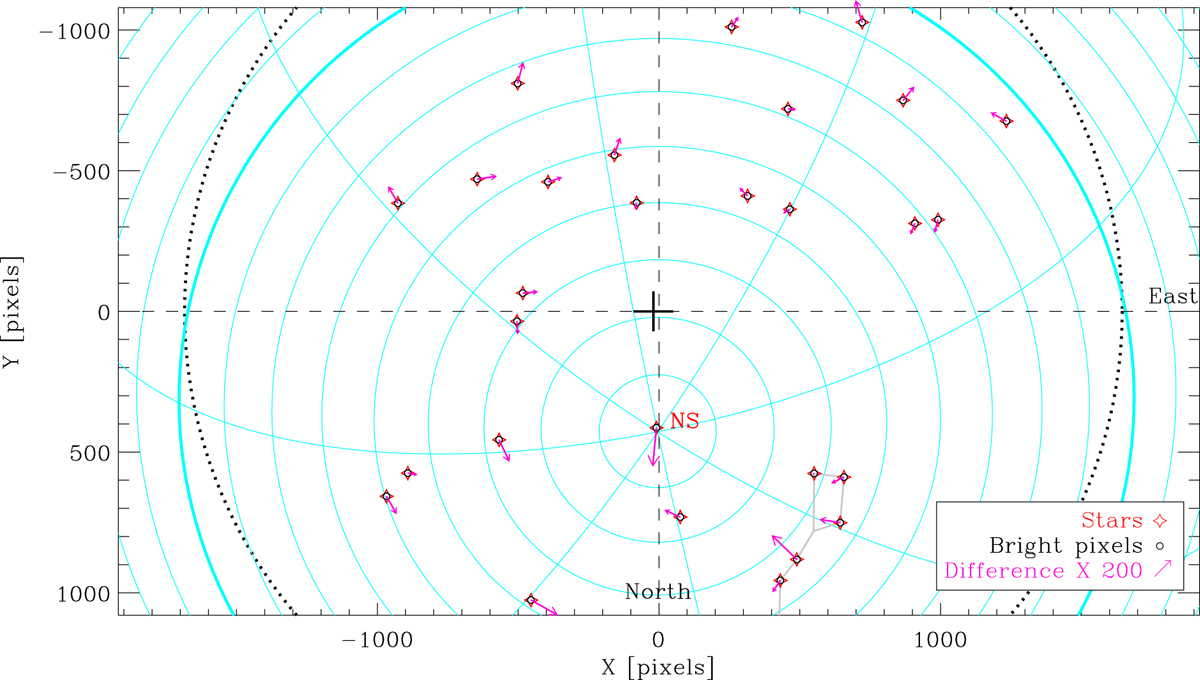
Comparison of the bright sources location and the position computed with the optical model, for one frame of one of the cameras. The bright pixels detected in the camera image are shown as black circles, while the expected position of the associated stars, computed by equation (7) with the eight camera parameters obtained in Section 3.3, are shown as red stars. The residual discrepancies between the two, multiplied by 200, are shown as magenta arrows. The thick black dots outline the approximate landscape horizon on the image; the black cross close to the image center shows the optics focal point; and the cyan lines represent the equatorial graticule, with a spacing of 10∘ in (equatorial) colatitude and 45∘ in longitude. The Northern Star is marked NS, while the “dipper” part of Ursa Major, in the North-East quadrant, is outlined in grey.
Current usage metrics show cumulative count of Article Views (full-text article views including HTML views, PDF and ePub downloads, according to the available data) and Abstracts Views on Vision4Press platform.
Data correspond to usage on the plateform after 2015. The current usage metrics is available 48-96 hours after online publication and is updated daily on week days.
Initial download of the metrics may take a while.