Fig. 3
Download original image
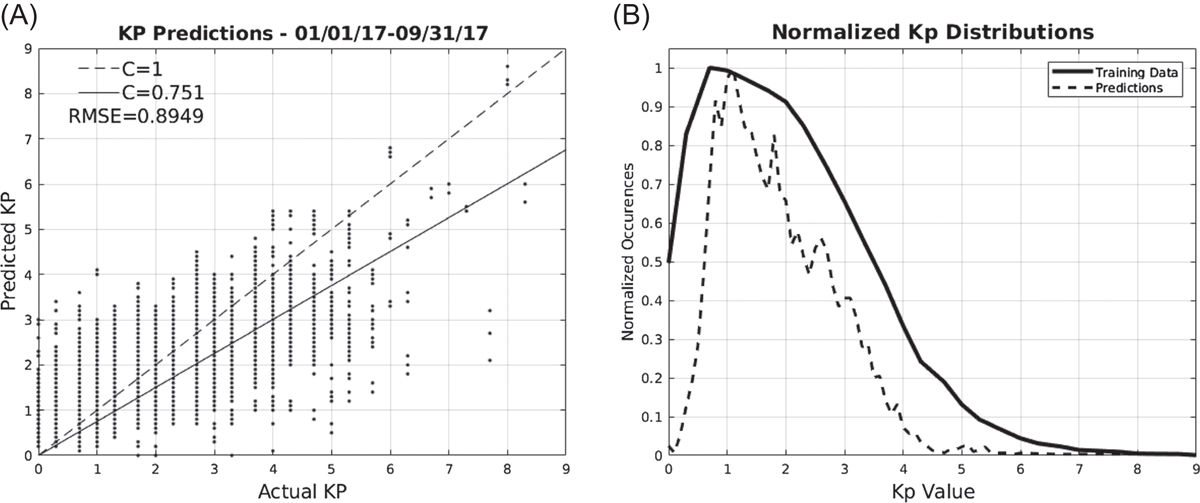
(A) 6528 Kp predictions with τ = 24, 01/01/2017–09/30/17 with inputs Bz, n, σB. Each dot is a prediction plotted against its corresponding true Kp value, and the solid line indicates the line of best fit with a slope of C = 0.751. Also shown is a line of slope 1, corresponding to an ideal correlation value. (B) Frequency of Kp values for full data set 1986–2016 and 2017 predictions. The imbalance of low Kp to high Kp in both sets is evident.
Current usage metrics show cumulative count of Article Views (full-text article views including HTML views, PDF and ePub downloads, according to the available data) and Abstracts Views on Vision4Press platform.
Data correspond to usage on the plateform after 2015. The current usage metrics is available 48-96 hours after online publication and is updated daily on week days.
Initial download of the metrics may take a while.