Fig. 4
Download original image
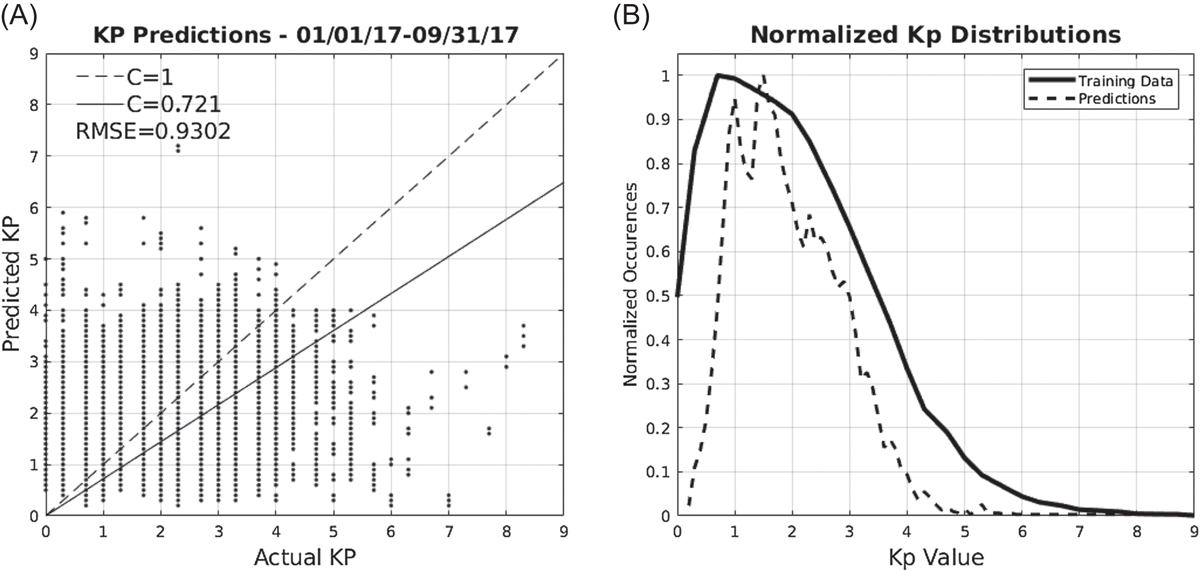
(A) 6528 Kp predictions with τ = 30, 01/01/2017–09/30/17 with inputs Bz, n, σB. (B) Frequency of Kp values for full data set 1986–2016 and 2017 predictions. Compared with Figure 3, a smaller range of predicted Kp values is seen in both plots.
Current usage metrics show cumulative count of Article Views (full-text article views including HTML views, PDF and ePub downloads, according to the available data) and Abstracts Views on Vision4Press platform.
Data correspond to usage on the plateform after 2015. The current usage metrics is available 48-96 hours after online publication and is updated daily on week days.
Initial download of the metrics may take a while.