Fig. 12

Download original image
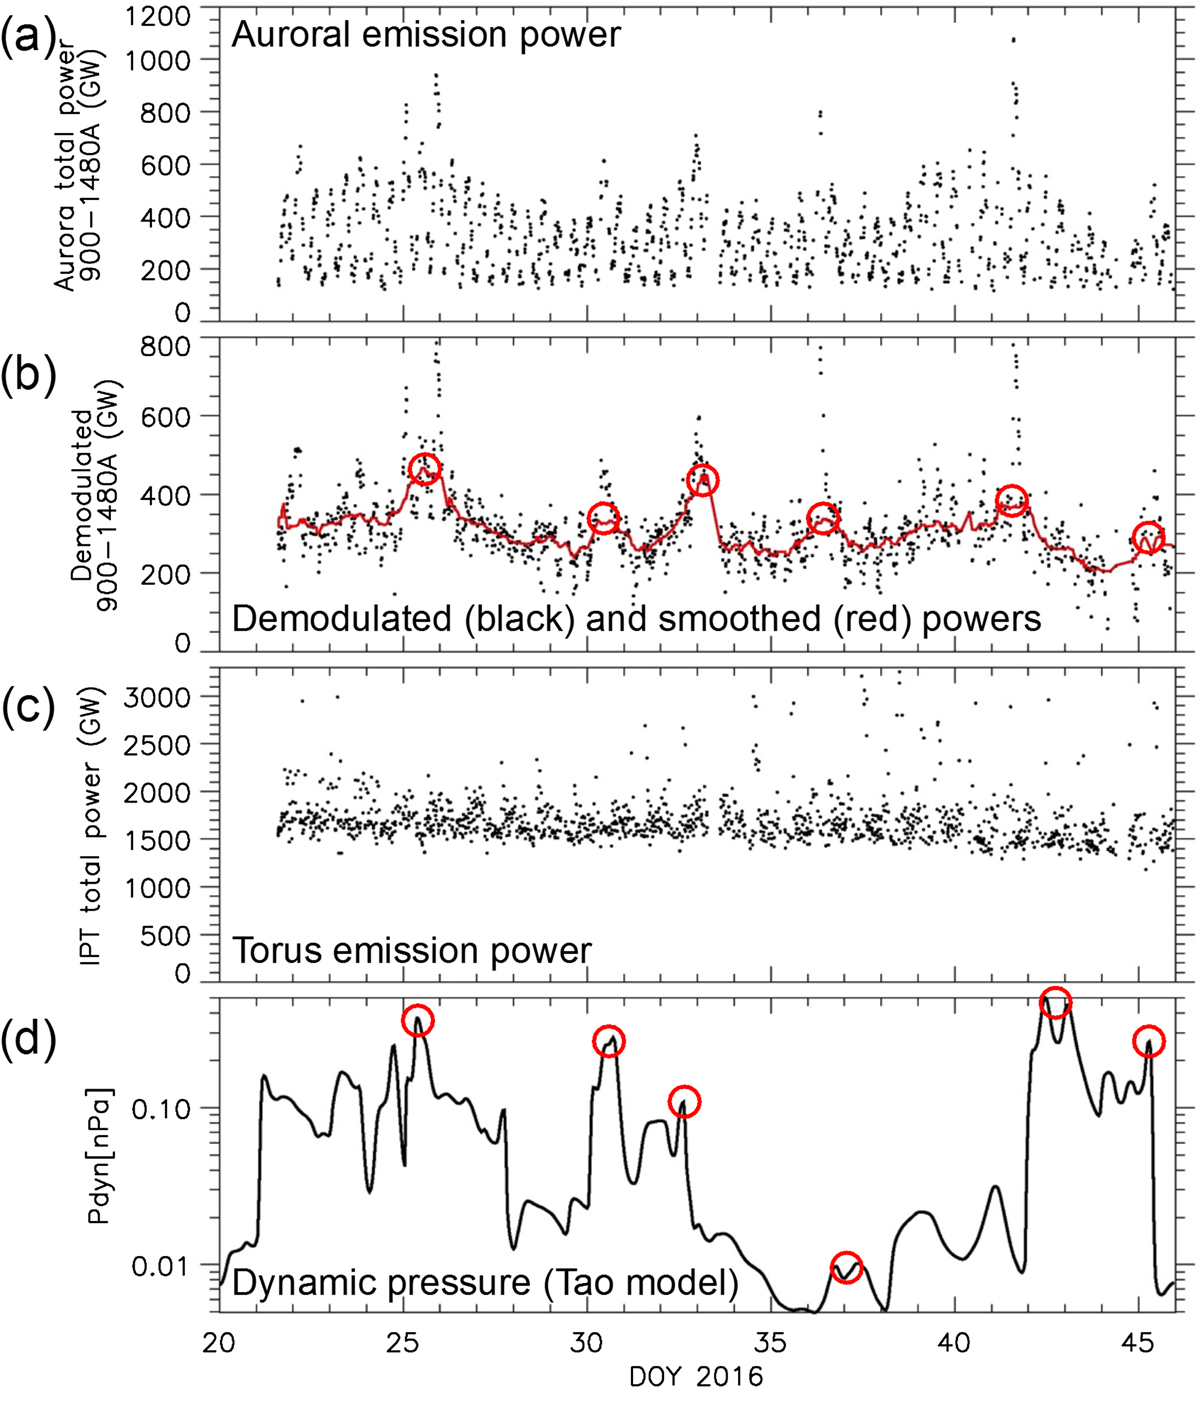
Example of Hisaki monitoring of Jupiter’s aurora and plasma torus observed on DOY 21-46, 2016. (a) Emission power of Jupiter’s northern aurora. (b) Demodulated (black dots) and smoothed (red solid line) of auroral emission power (see Kimura et al. (2018) for the demodulation and smoothing methods). Local maxima in the smoothed power are indicated with red circles. (c) Emission power of the torus. It is of note that some data dots away from the monotonically decreasing trend are contaminated with the radiation background; this was observed when Hisaki flew through the Southern Atlantic Anomaly. (d) Solar wind dynamic pressure extrapolated from Earth’s orbit by a one-dimensional MHD simulation (Tao et al., 2005). Local maxima in the dynamic pressure closest to those in the smoothed auroral power are indicated by red solid circles.
Current usage metrics show cumulative count of Article Views (full-text article views including HTML views, PDF and ePub downloads, according to the available data) and Abstracts Views on Vision4Press platform.
Data correspond to usage on the plateform after 2015. The current usage metrics is available 48-96 hours after online publication and is updated daily on week days.
Initial download of the metrics may take a while.


