Open Access
Fig. 4
Download original image
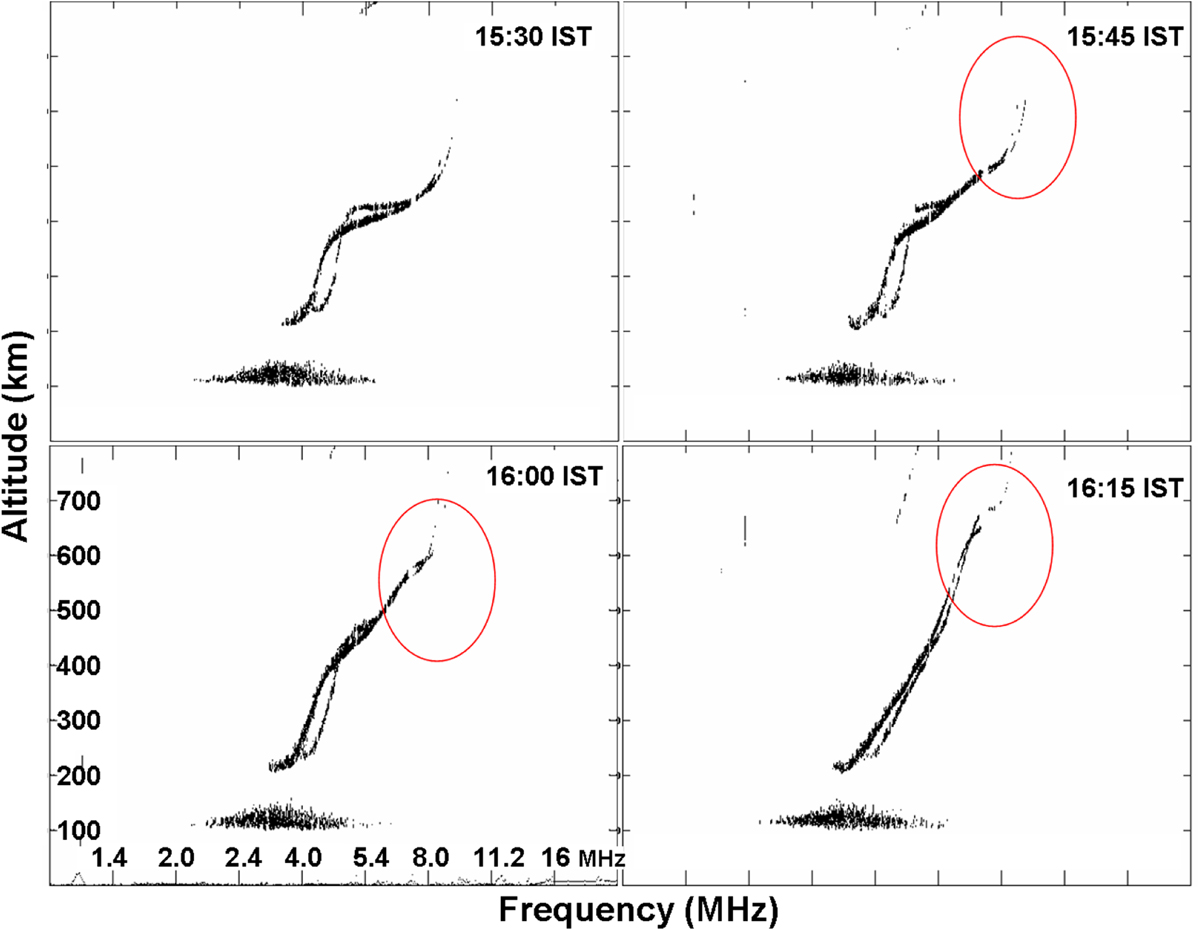
Temporal evolution of F3 layers (shown in circles) over Trivandrum, as observed by the ionogram traces on August 24, 2005. The corresponding times in IST are shown in the top right corners.
Current usage metrics show cumulative count of Article Views (full-text article views including HTML views, PDF and ePub downloads, according to the available data) and Abstracts Views on Vision4Press platform.
Data correspond to usage on the plateform after 2015. The current usage metrics is available 48-96 hours after online publication and is updated daily on week days.
Initial download of the metrics may take a while.