Figure A.1
Download original image
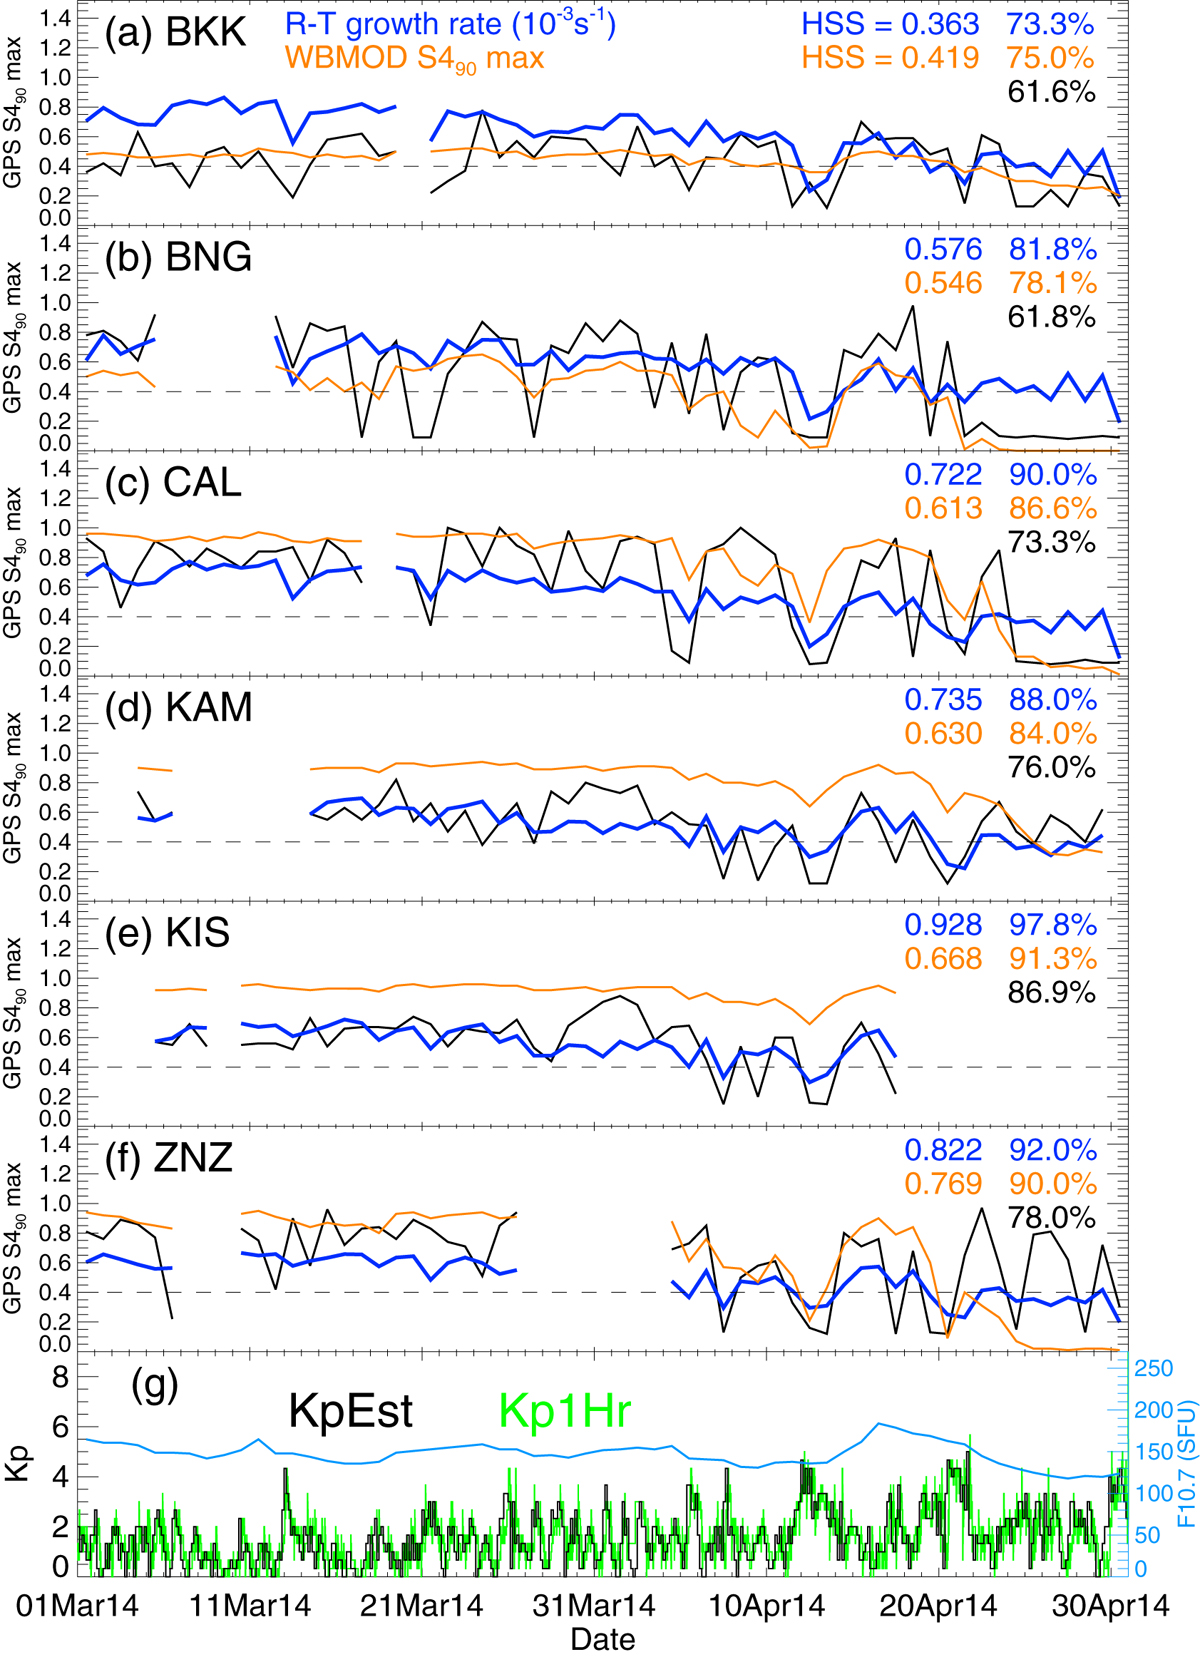
(a)–(f) The daily GPS S490 max observed by each GPS station throughout March and April of 2014 in black. The orange lines show the WBMOD predictions for GPS GPS S490 max and the blue lines show the TIEGCM R-T growth rate. In the top-right of each panel is the corresponding Heidke Skill Score and the percentage of correct EPB/non-EPB days forecast. The black percentage indicates the “persistence” forecast result. The dashed horizontal line indicates the S4 and R-T growth rate thresholds. (g) The real-time observed Kp (KpEst, black), the 1-hour predicted Kp (Kp1Hr, green) and the F10.7 solar flux (blue) throughout this period.
Current usage metrics show cumulative count of Article Views (full-text article views including HTML views, PDF and ePub downloads, according to the available data) and Abstracts Views on Vision4Press platform.
Data correspond to usage on the plateform after 2015. The current usage metrics is available 48-96 hours after online publication and is updated daily on week days.
Initial download of the metrics may take a while.