Open Access
Fig. 1
Download original image
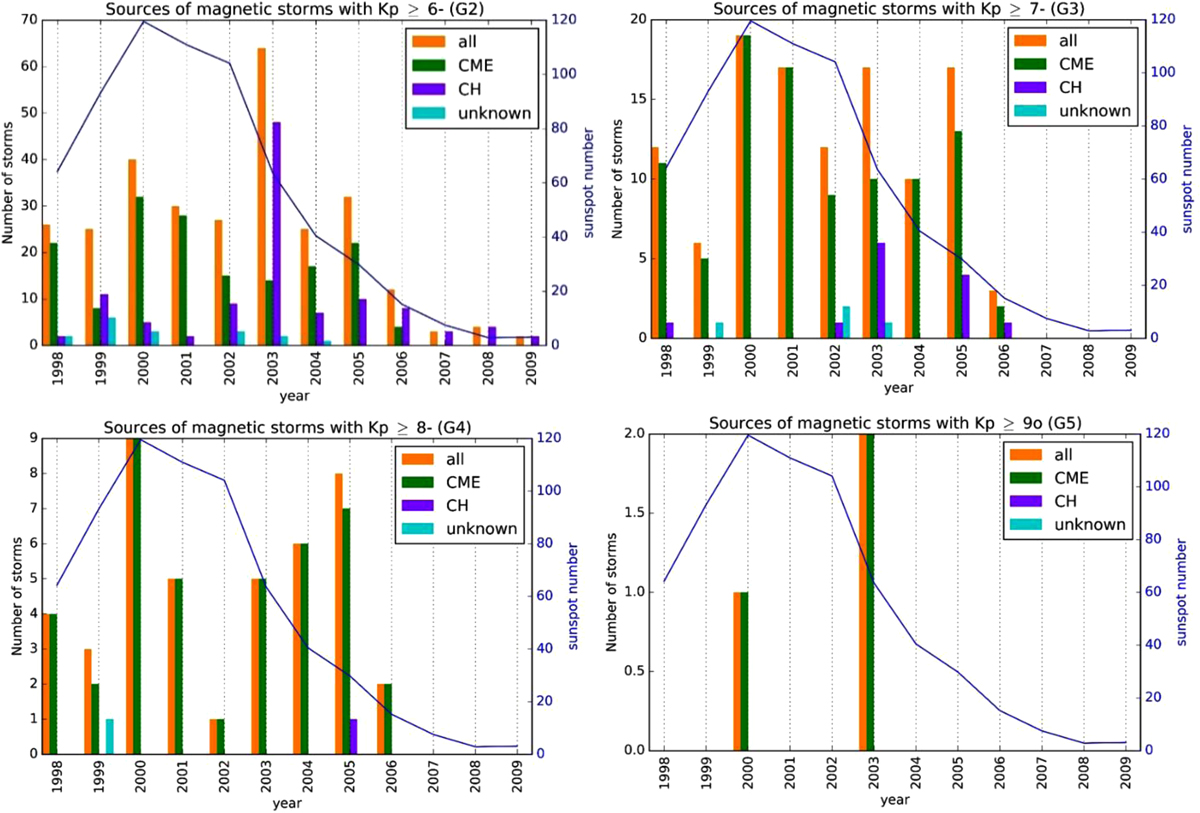
Number of storms per year that led from Kp ≥ 6− to 9o (top left to bottom right), between 1998 and 2009 inclusive (total of 290), separated by source (with total number in orange). Also shown is the average yearly sunspot number (blue line) to provide an indication of solar cycle dependence.
Current usage metrics show cumulative count of Article Views (full-text article views including HTML views, PDF and ePub downloads, according to the available data) and Abstracts Views on Vision4Press platform.
Data correspond to usage on the plateform after 2015. The current usage metrics is available 48-96 hours after online publication and is updated daily on week days.
Initial download of the metrics may take a while.