Open Access
Figure 2
Download original image
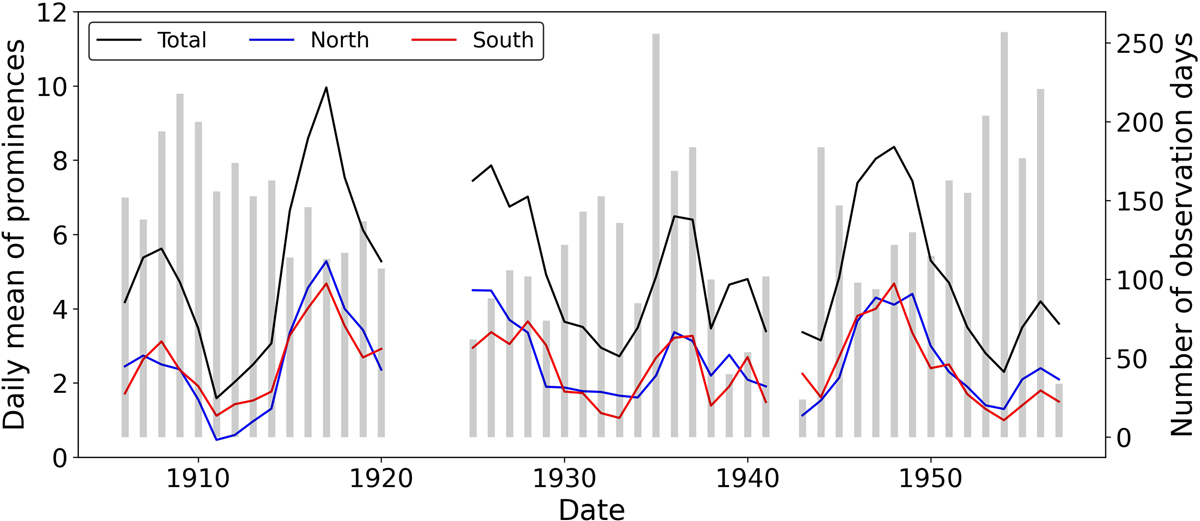
Daily mean of the number of prominences recorded at the Madrid Astronomical Observatory for the period 1906–1957. The total, north, and south number are represented by black, blue, and red lines, respectively. The annual number of observation days is depicted by gray bars.
Current usage metrics show cumulative count of Article Views (full-text article views including HTML views, PDF and ePub downloads, according to the available data) and Abstracts Views on Vision4Press platform.
Data correspond to usage on the plateform after 2015. The current usage metrics is available 48-96 hours after online publication and is updated daily on week days.
Initial download of the metrics may take a while.