Figure 3
Download original image
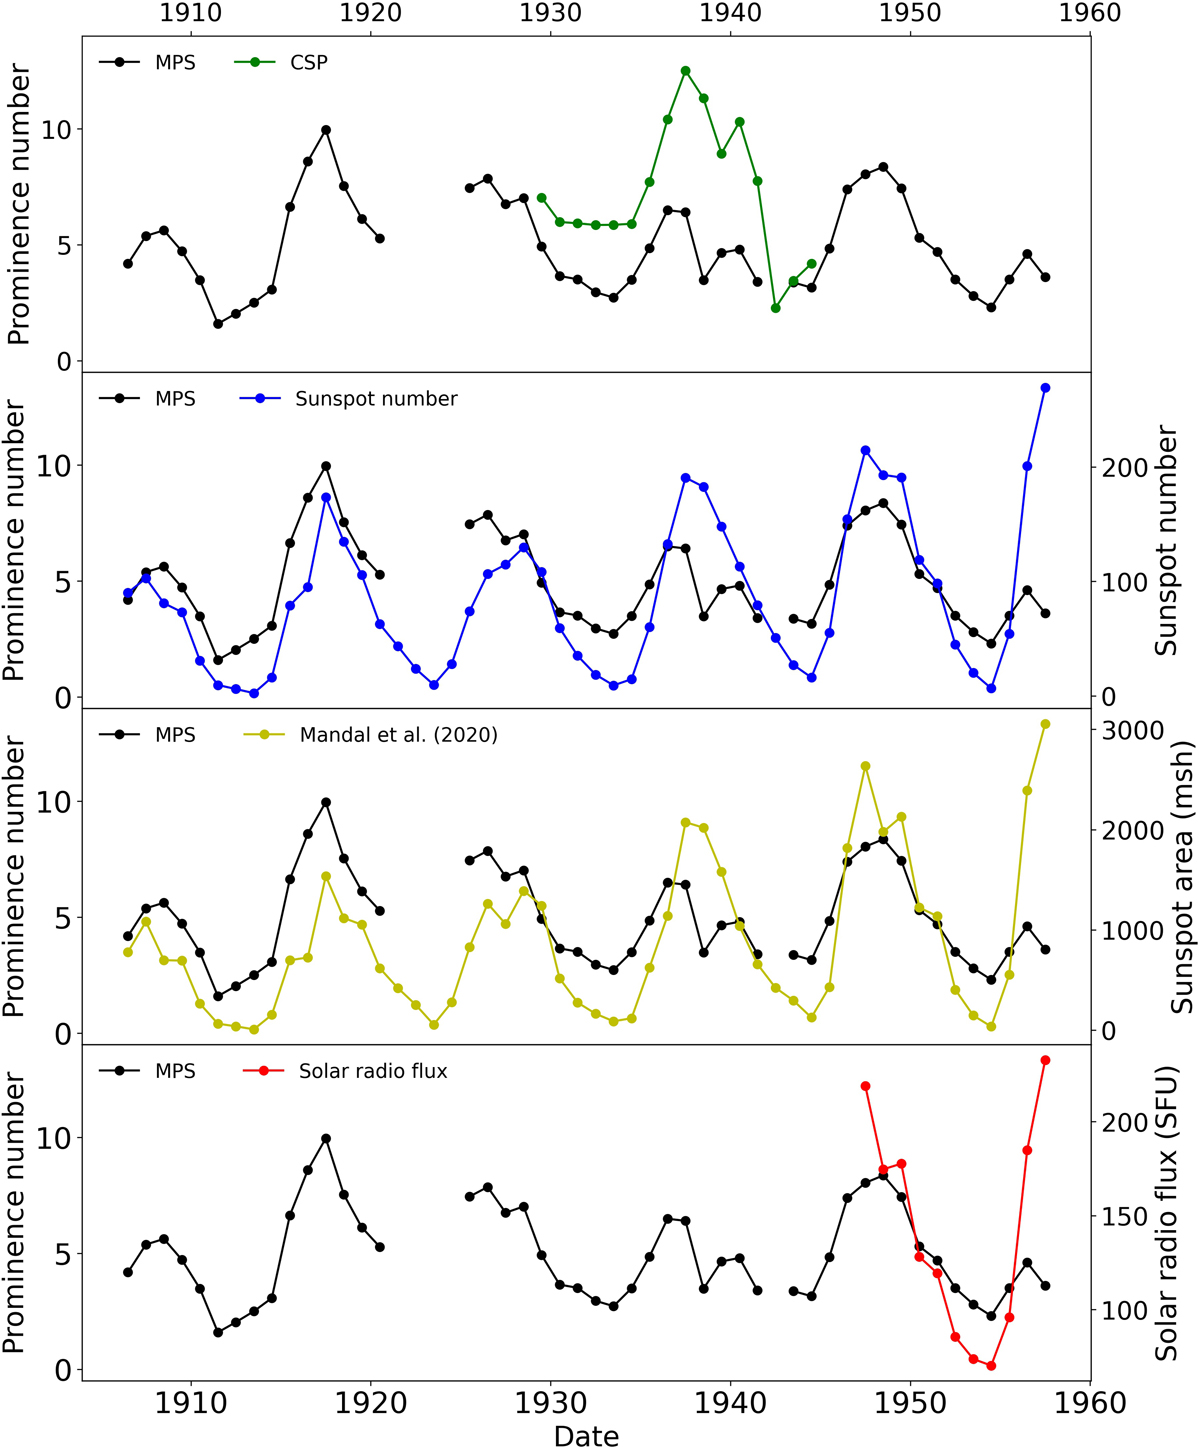
Comparison between the daily mean of the number of prominences recorded at the Madrid Astronomical Observatory for the period 1906–1957 (black) and, from top to bottom, the number of prominences recorded at the Astronomical Observatory of the University of Coimbra for the period 1929–1944 (dark green), the sunspot number for the period 1906–1957 (blue), the sunspot area by Mandal et al. (2020) for the period 1906–1957 (yellow), and the solar radio flux at 10.7 cm for the period 1947–1957 (red).
Current usage metrics show cumulative count of Article Views (full-text article views including HTML views, PDF and ePub downloads, according to the available data) and Abstracts Views on Vision4Press platform.
Data correspond to usage on the plateform after 2015. The current usage metrics is available 48-96 hours after online publication and is updated daily on week days.
Initial download of the metrics may take a while.