Figure 5
Download original image
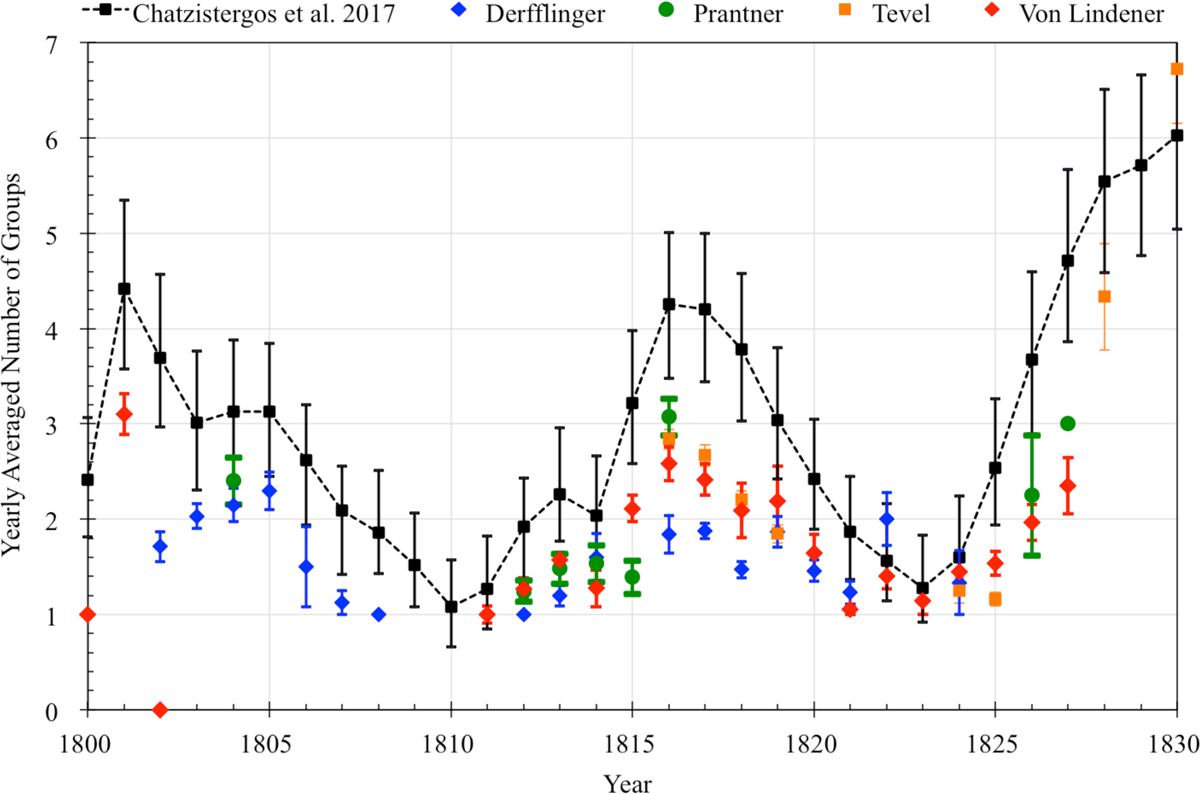
Yearly sunspot group number of von Lindener (red diamonds), Derfflinger in his summary manuscript (blue circles: Hayakawa et al., 2020b), Prantner (blue diamonds: Hayakawa et al., 2021a), and Tevel (orange squares: Carrasco, 2022). For reference, these data are compared with the annual sunspot group number of Chatzistergos et al. (2017), which has been regarded as “the most recommendable version for further analysis” in Petrovay (2020, p. 11). Accordingly, we have calculated the error margins for the individual data series in a standard error, whereas we have derived the error margins of Appendix B in Chatzistergos et al. (2017).
Current usage metrics show cumulative count of Article Views (full-text article views including HTML views, PDF and ePub downloads, according to the available data) and Abstracts Views on Vision4Press platform.
Data correspond to usage on the plateform after 2015. The current usage metrics is available 48-96 hours after online publication and is updated daily on week days.
Initial download of the metrics may take a while.