Figure 1

Download original image
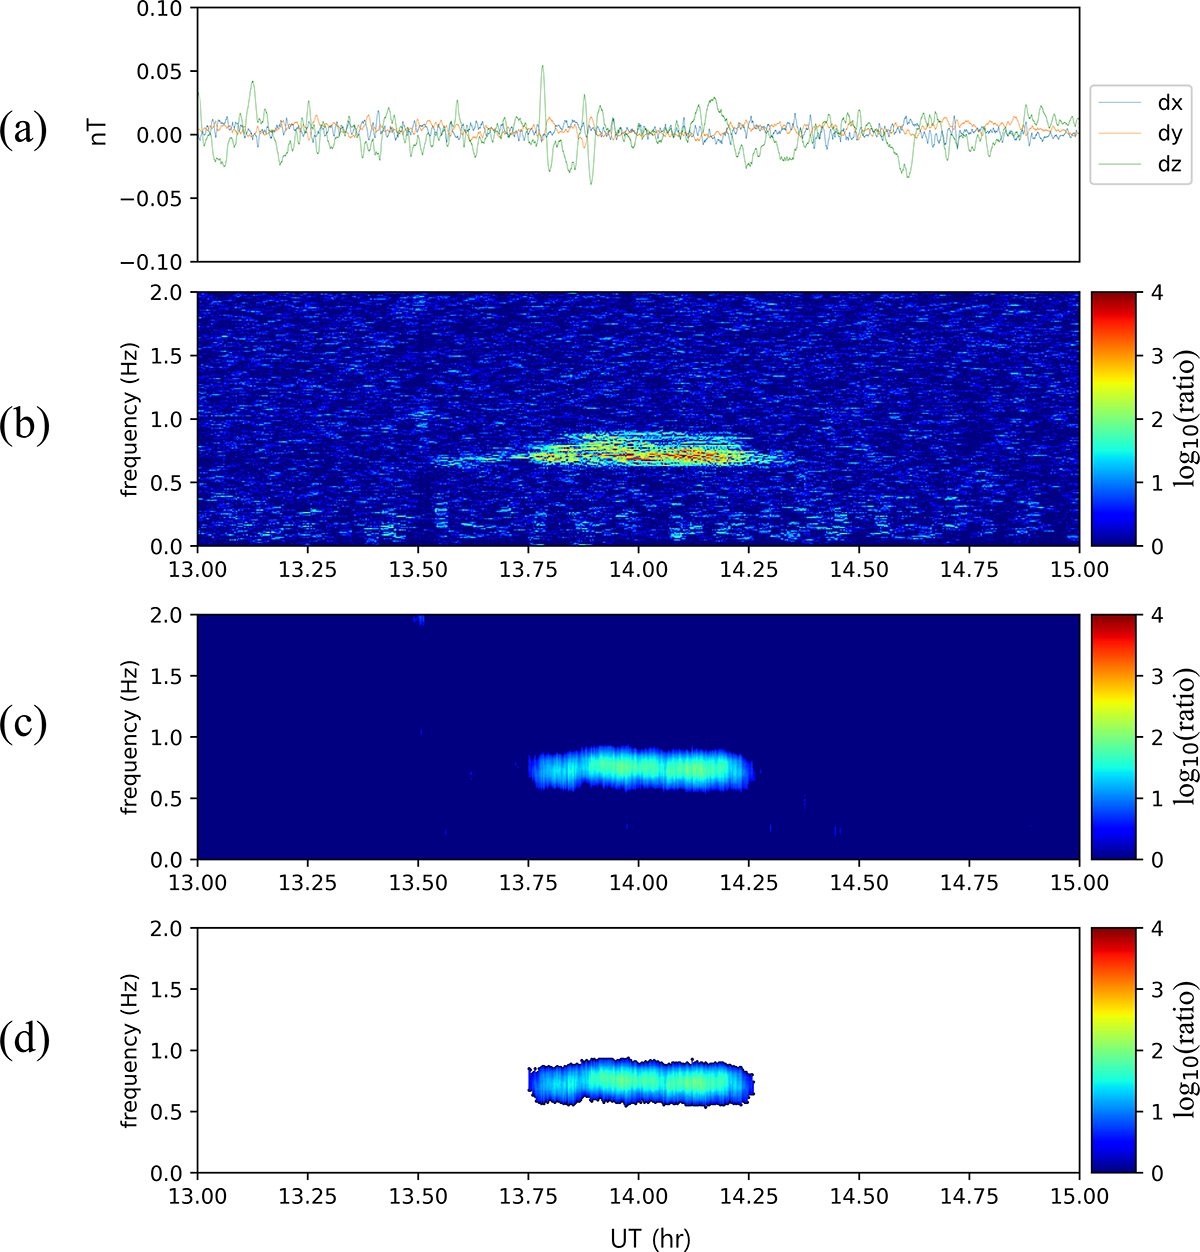
An example of steps for detecting a wave on 29 November 2011. (a) Variations of magnetic field for three axes of the magnetometer. (b) A power spectral density (PSD) graph expressed with a logarithmic value of the signal ratio. The ratio is calculated by Ri(f) = Ci(f)/M(f) in step 3. (c) A PSD graph after end of the steps. Savgol (Savitzky-Golay) filter is applied to the PSD along the frequency domain, and non-wave signals are removed. (d) A PSD graph only with a valid wave event. The upper, bottom and peak frequency of the identified wave is automatically recorded.
Current usage metrics show cumulative count of Article Views (full-text article views including HTML views, PDF and ePub downloads, according to the available data) and Abstracts Views on Vision4Press platform.
Data correspond to usage on the plateform after 2015. The current usage metrics is available 48-96 hours after online publication and is updated daily on week days.
Initial download of the metrics may take a while.


