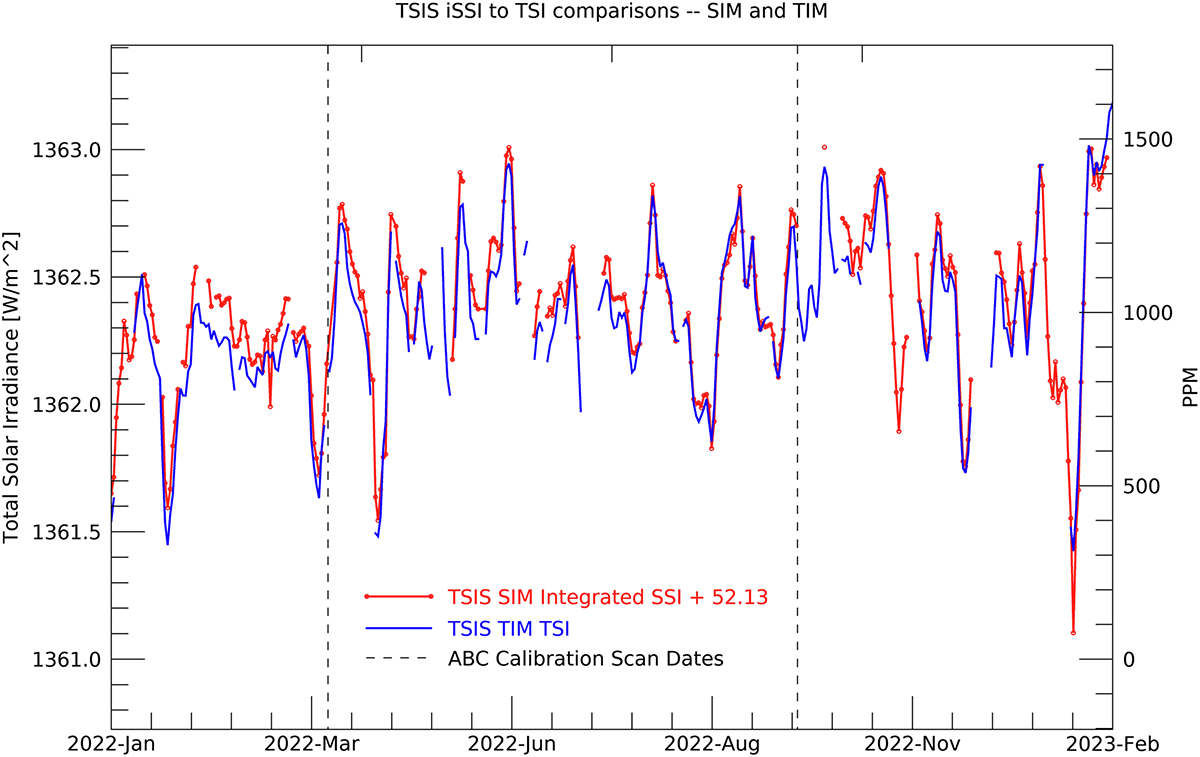
Figure 11

Download original image
Comparison of the integrated (200–2400 nm) SIM (iSSI) + 52.13 Wm−2 (red) to the TSIS-1 TIM measured TSI (blue) covering the year 2022 (January 1, 2022–February 1, 2023). This shows the excellent agreement for both the annual trending as well as the short-term (solar rotational) structure during activity in SC25. Note that some differences are due to sampling differences in the interpolation of the measurements to a common temporal grid (due to the different timing of the daily observations). Small data gaps for each instrument are specific to ISS activities that preclude measurements and are different for each sensor.
Current usage metrics show cumulative count of Article Views (full-text article views including HTML views, PDF and ePub downloads, according to the available data) and Abstracts Views on Vision4Press platform.
Data correspond to usage on the plateform after 2015. The current usage metrics is available 48-96 hours after online publication and is updated daily on week days.
Initial download of the metrics may take a while.


