Figure 12

Download original image
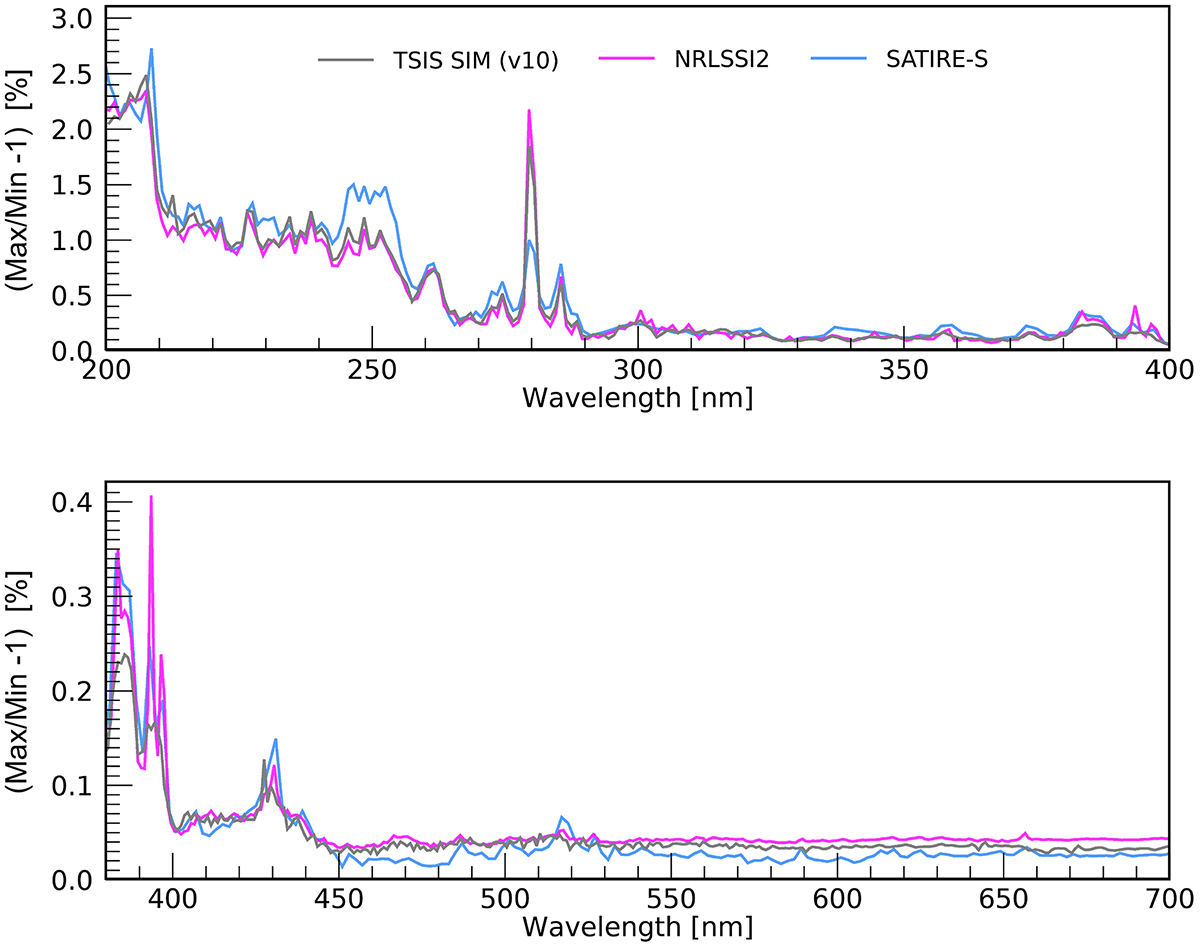
Comparison of the solar rotational relative spectral variability between TSIS-1 SIM observations (grey) with the NRLSSI2 model (pink) and SATIRE-S model (blue) for active region contrast in August 2022 when multiple active regions were present during a solar 27-day rotational period. Here maximum activity condition is the average SSI for the August 9–12, 2022 time frame, and the minimum activity condition is represented by the average SSI for August 23–26, 2022 (see Fig. 13).
Current usage metrics show cumulative count of Article Views (full-text article views including HTML views, PDF and ePub downloads, according to the available data) and Abstracts Views on Vision4Press platform.
Data correspond to usage on the plateform after 2015. The current usage metrics is available 48-96 hours after online publication and is updated daily on week days.
Initial download of the metrics may take a while.


