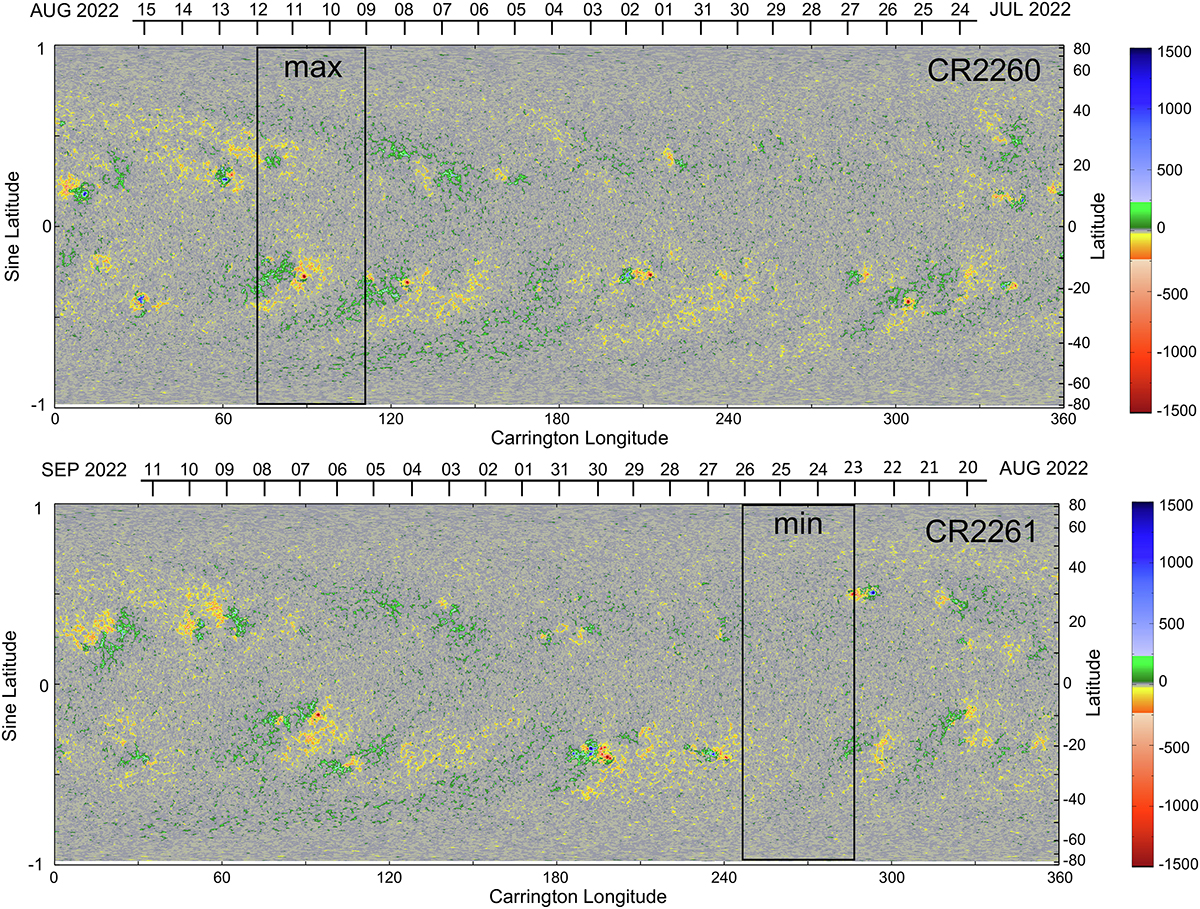
Figure 13

Download original image
HMI line-of-sight (LOS) synoptic charts showing magnetogram images of solar activity for early and late August 2022 (covering CR2260 & CR2261) highlighting the time periods for the active region days used for the short-term irradiance variability shown in Figure 12. For the SSI variability plot in Figure 12, the maximum and minimum activity periods are defined as SSI averages over ~4 consecutive days for disk-centered times of August 9–12, 2022, and August 23–26, 2022, respectively. (Images courtesy of NASA/SDO and the HMI science team: http://hmi.stanford.edu/data/synoptic.html).
Current usage metrics show cumulative count of Article Views (full-text article views including HTML views, PDF and ePub downloads, according to the available data) and Abstracts Views on Vision4Press platform.
Data correspond to usage on the plateform after 2015. The current usage metrics is available 48-96 hours after online publication and is updated daily on week days.
Initial download of the metrics may take a while.


