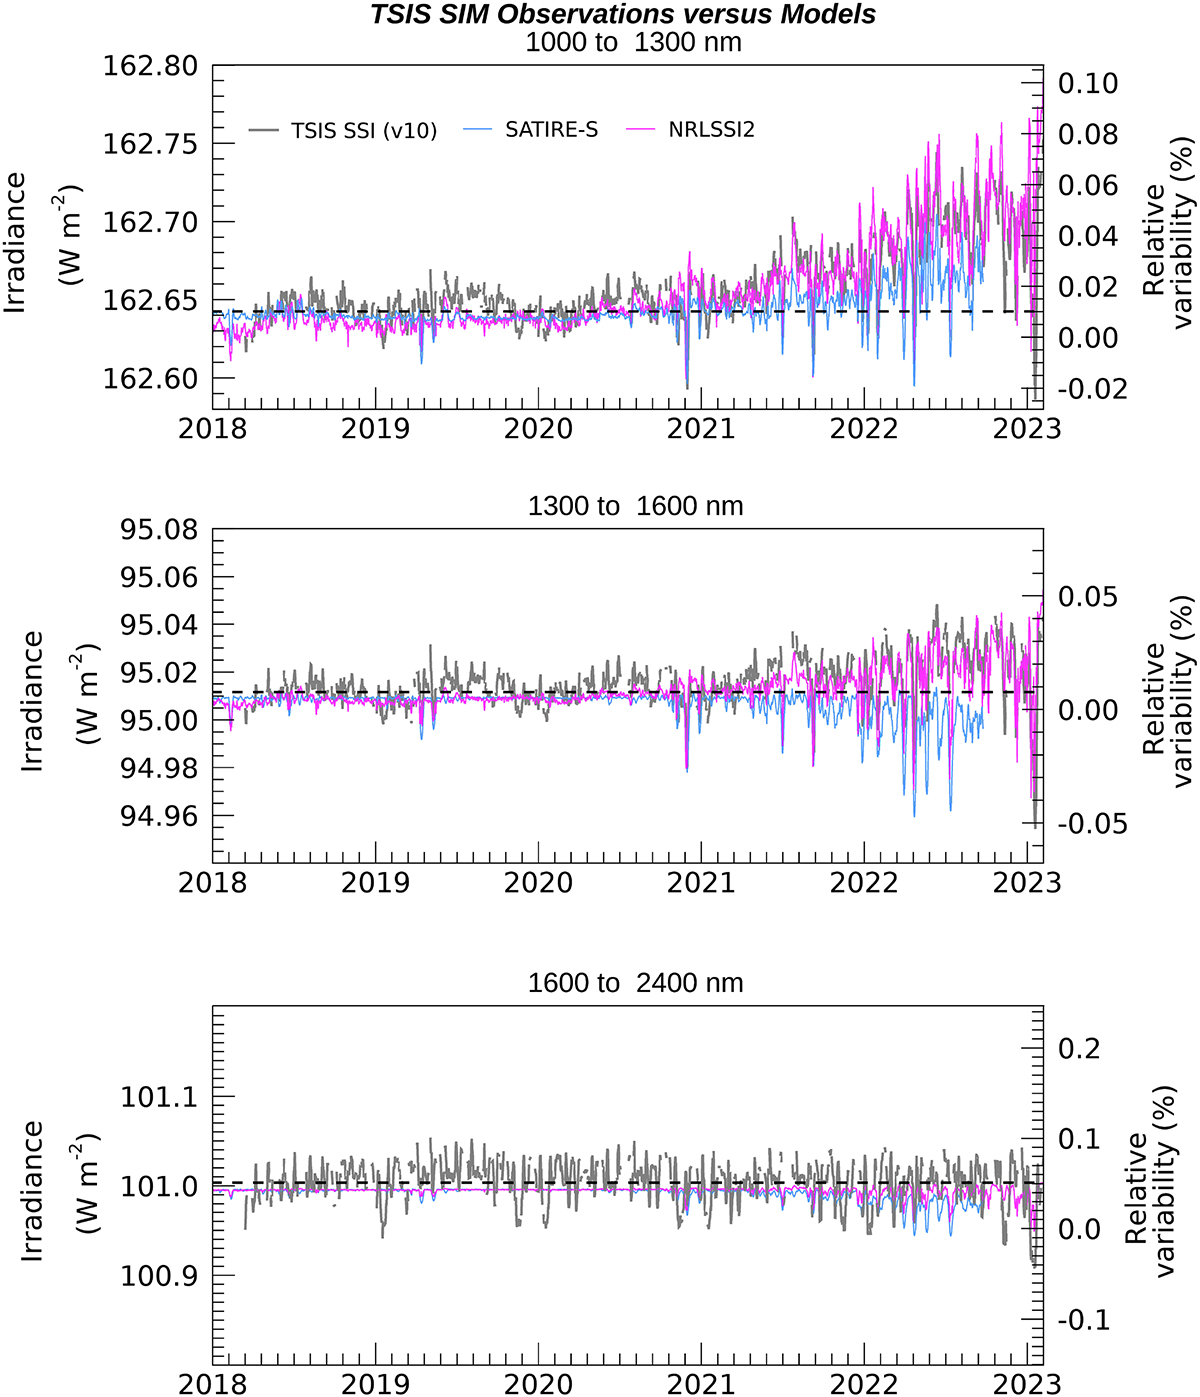
Figure 15

Download original image
SSI variability comparisons in broadbands covering the near IR (1000–1300 nm & 1300–1600 nm) and short-wave IR (1600–2400 nm) of TSIS-1 SIM observations (grey) to the NRLSSI2 model (pink) and SATIRE-S model (blue) over the first 5 years of the TSIS-1 mission. For the near IR wavelengths there is a small (~100 ppm peak) annual residual signal that is instrumental in origin (see text). This is most noticeable in the first three years of the mission but is also persistent in the SC25 onset. For the longest wavelength region (1600–2400 nm) the measurements here are made by the ESR detector (bolometer-based) and are more sensitive to seasonal adverse temperature time periods due to the ISS orbit in December and January (this is observed as uncorrected irradiance dips at these months for each year).
Current usage metrics show cumulative count of Article Views (full-text article views including HTML views, PDF and ePub downloads, according to the available data) and Abstracts Views on Vision4Press platform.
Data correspond to usage on the plateform after 2015. The current usage metrics is available 48-96 hours after online publication and is updated daily on week days.
Initial download of the metrics may take a while.


