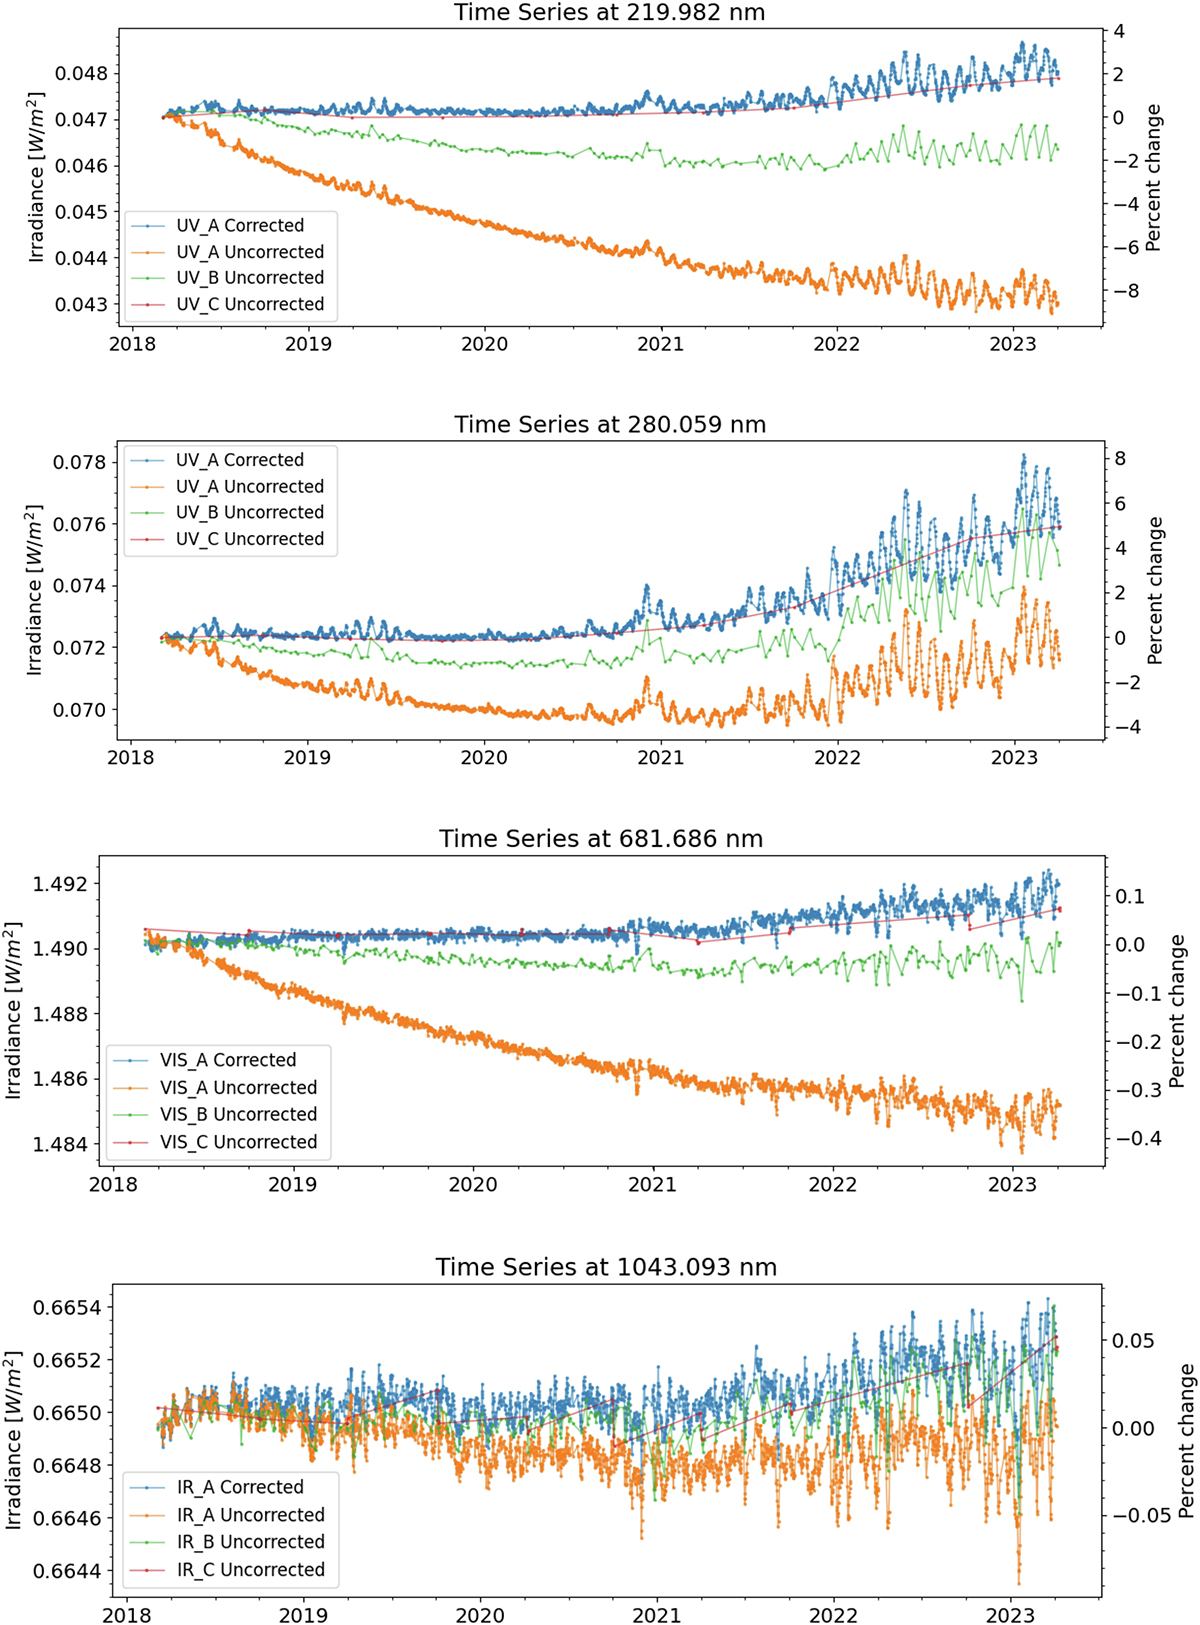
Figure A.1

Download original image
Examples of SIM channel data as a function of mission calendar day for UV through near-IR wavelengths. The orange, green, and red traces show the raw, uncorrected SSI data for SIM Channel A, B, and C, respectively. Note the relative percent change scale on the right axis. The dominant optical degradation occurs in the UV at 220 nm where the optical throughput has decreased by ~10% over 5 years for SIM Channel A. Degradations for SIM Channel B and C are less in direct proportion to the decreases in solar exposure time for those channels. The Channel C data are used to correct Channel B data, and then the corrected Channel B data are used to correct Channel A data (blue traces in the plots). As can be seen in the visible (682 nm) and near-IR (1043 nm) plots, optical degradation is relatively small but still requires correction. Channel-to-channel ratio fits versus solar exposure time separates the degradation from solar activity changes.
Current usage metrics show cumulative count of Article Views (full-text article views including HTML views, PDF and ePub downloads, according to the available data) and Abstracts Views on Vision4Press platform.
Data correspond to usage on the plateform after 2015. The current usage metrics is available 48-96 hours after online publication and is updated daily on week days.
Initial download of the metrics may take a while.


