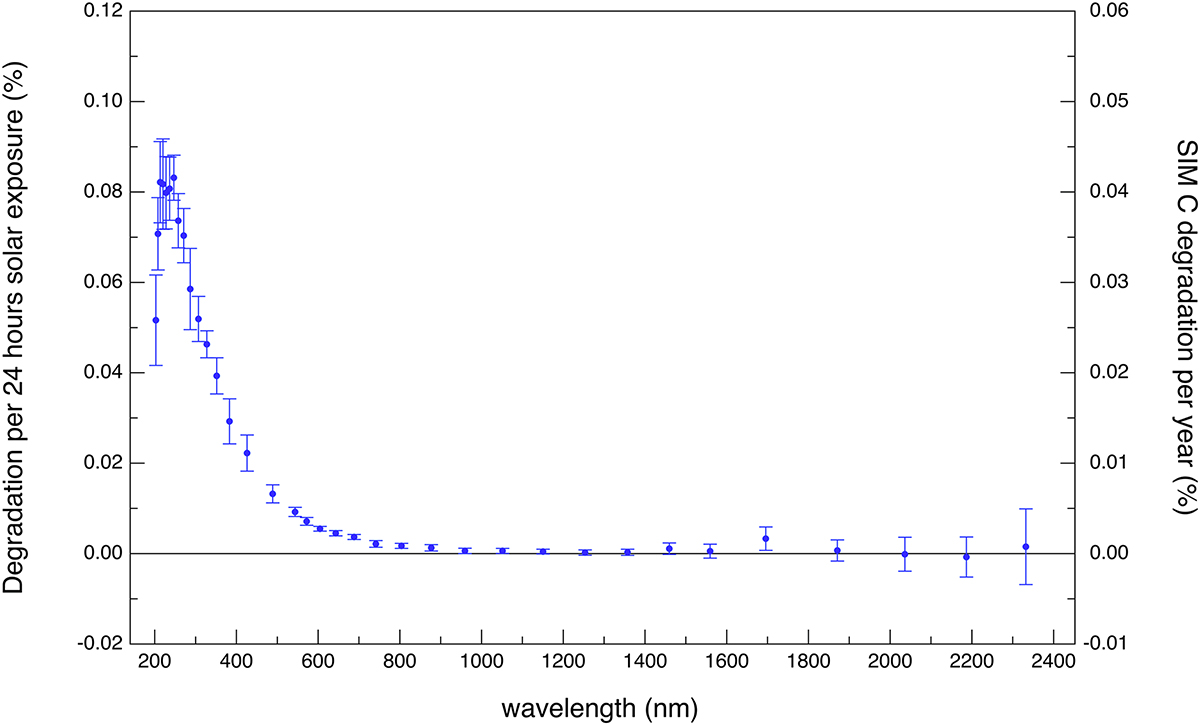
Figure A.3

Download original image
TSIS-1 SIM spectral degradation rate as a function of solar exposure. Results here are derived from the SIM A to SIM B spectral ratios (as defined by the form of Eq. (A.5)) and the exponential fits. The individual 1 − σ error bars are representative of the standard deviation of the exponential fits to the cumulative solar exposure time. The dominant degradation occurs near 220 nm and is plotted as a rate based on 24-hours of solar exposure. The SIM channel C is corrected with this degradation rate based on the SIM channel C cumulative exposure time. SIM Channel C experiences 12 h of solar exposure per year (6 h per 6-month calibration cadence).
Current usage metrics show cumulative count of Article Views (full-text article views including HTML views, PDF and ePub downloads, according to the available data) and Abstracts Views on Vision4Press platform.
Data correspond to usage on the plateform after 2015. The current usage metrics is available 48-96 hours after online publication and is updated daily on week days.
Initial download of the metrics may take a while.


