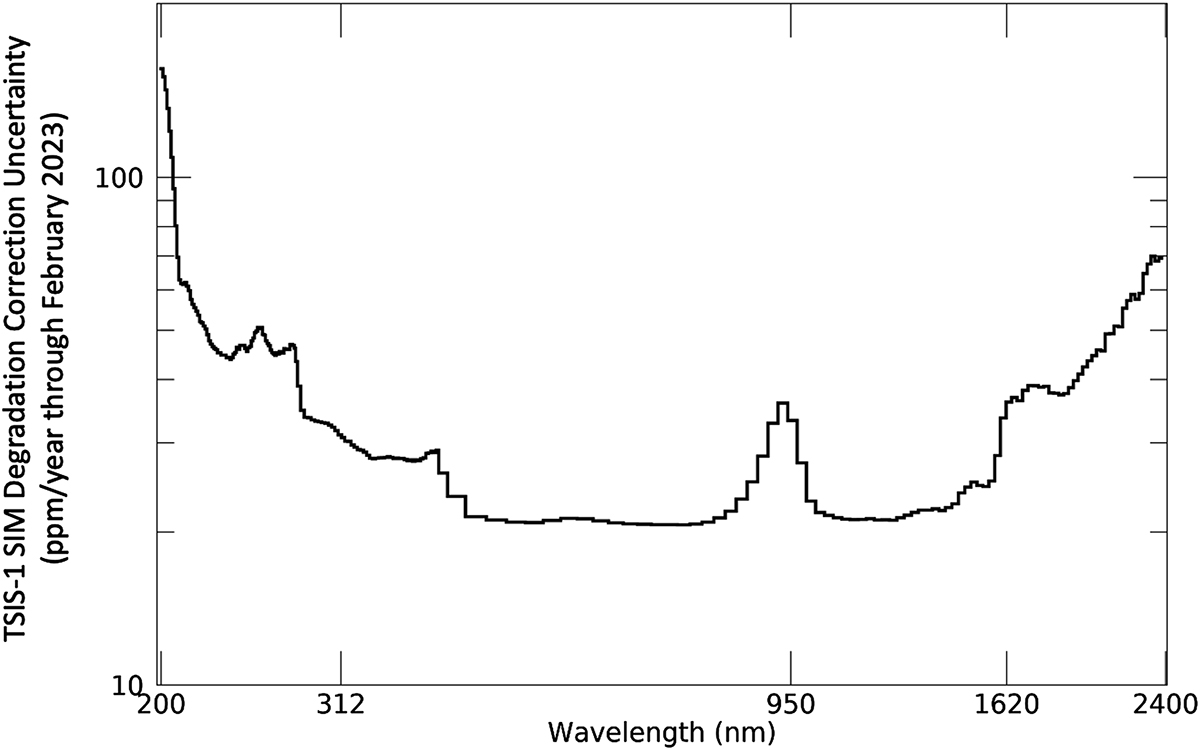
Figure A.4

Download original image
TSIS-1 SIM degradation correction uncertainties for the spectral stability corrections (relative ppm/year) as a function of wavelength for the binned sampling of the Level-3 SSI data product through February 2023. The spectral sampling involves 1 nm bins for 200–280 nm, 2.5 nm bins for 281–400 nm, and then 22.5 nm bins for wavelengths greater than 400 nm. Detector (and gain) transition regions are apparent in the relative uncertainty by the strongly changing gradients across the spectra, noticeable in the 800–1000 nm region (visible to IR detector transition) and at ~1650 nm (ESR detector transition). The numeric wavelength labels designate the various detector transitions across the spectrum in producing the final SSI data product.
Current usage metrics show cumulative count of Article Views (full-text article views including HTML views, PDF and ePub downloads, according to the available data) and Abstracts Views on Vision4Press platform.
Data correspond to usage on the plateform after 2015. The current usage metrics is available 48-96 hours after online publication and is updated daily on week days.
Initial download of the metrics may take a while.


