Figure 3

Download original image
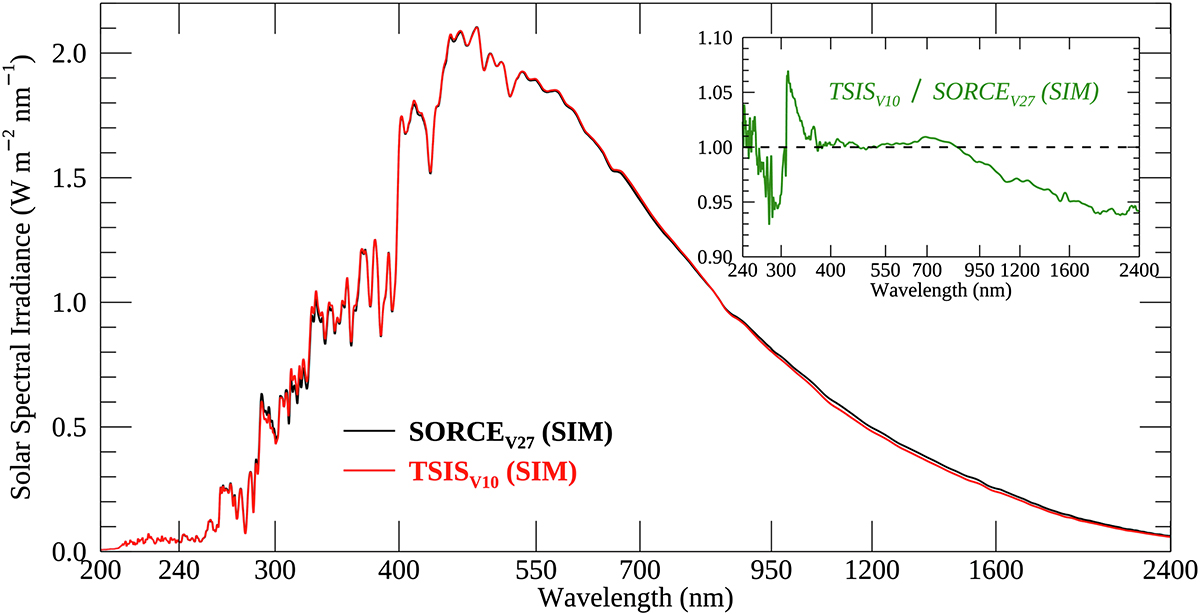
The SSI spectrum comparison of TSIS-1 SIM (red) and SORCE SIM (black) for the overlap time of TSIS-1 and SORCE missions covering the full range of 200–2400 nm (note: wavelength is plotted on a log-scale). Both spectra are plotted on their native irradiance scales (no scaling applied). The inset shows the ratio (green) as a function of wavelength over the 240–2400 nm range (below 240 nm, the SORCE SIM has large relative uncertainties). Clearly seen is the lower IR SSI longward of 900 nm, up to ~6% lower for TSIS-1 SIM. However, excellent agreement is seen throughout the visible where the SSI is a maximum.
Current usage metrics show cumulative count of Article Views (full-text article views including HTML views, PDF and ePub downloads, according to the available data) and Abstracts Views on Vision4Press platform.
Data correspond to usage on the plateform after 2015. The current usage metrics is available 48-96 hours after online publication and is updated daily on week days.
Initial download of the metrics may take a while.


