Figure 7

Download original image
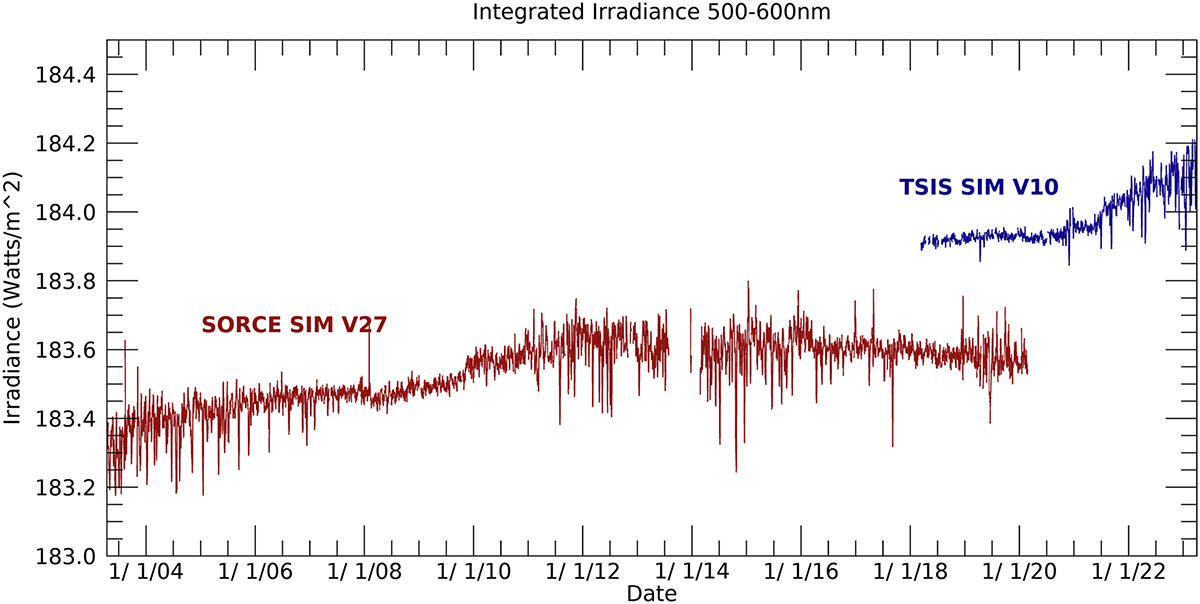
Comparison of solar visible irradiance in the 500–600 nm integrated region for the SORCE SIM and the TSIS-1 SIM. Again, the time period covers the decline of SC23, the full SC 24, and the ascending phase of SC25. Integrated irradiances are plotted on the native scales of each instrument. Notice for the SORCE SIM, the irradiance for the declining phase of SC23 (2004–2008) shows a trend out-of-phase with the TSI, however for SC24 there appears to be an in-phase relationship from 2008/09 minimum to 2019/20 minimum. Based on a linear trend covering the full SC24, SORCE SIM results here are consistent with ~150 ppm/year increase – a rate at the limit of the instrumental stability corrections. The TSIS-1 SIM irradiance from the last solar minimum into the ascending phase of SC25 is highly correlated with TSI (see text).
Current usage metrics show cumulative count of Article Views (full-text article views including HTML views, PDF and ePub downloads, according to the available data) and Abstracts Views on Vision4Press platform.
Data correspond to usage on the plateform after 2015. The current usage metrics is available 48-96 hours after online publication and is updated daily on week days.
Initial download of the metrics may take a while.


