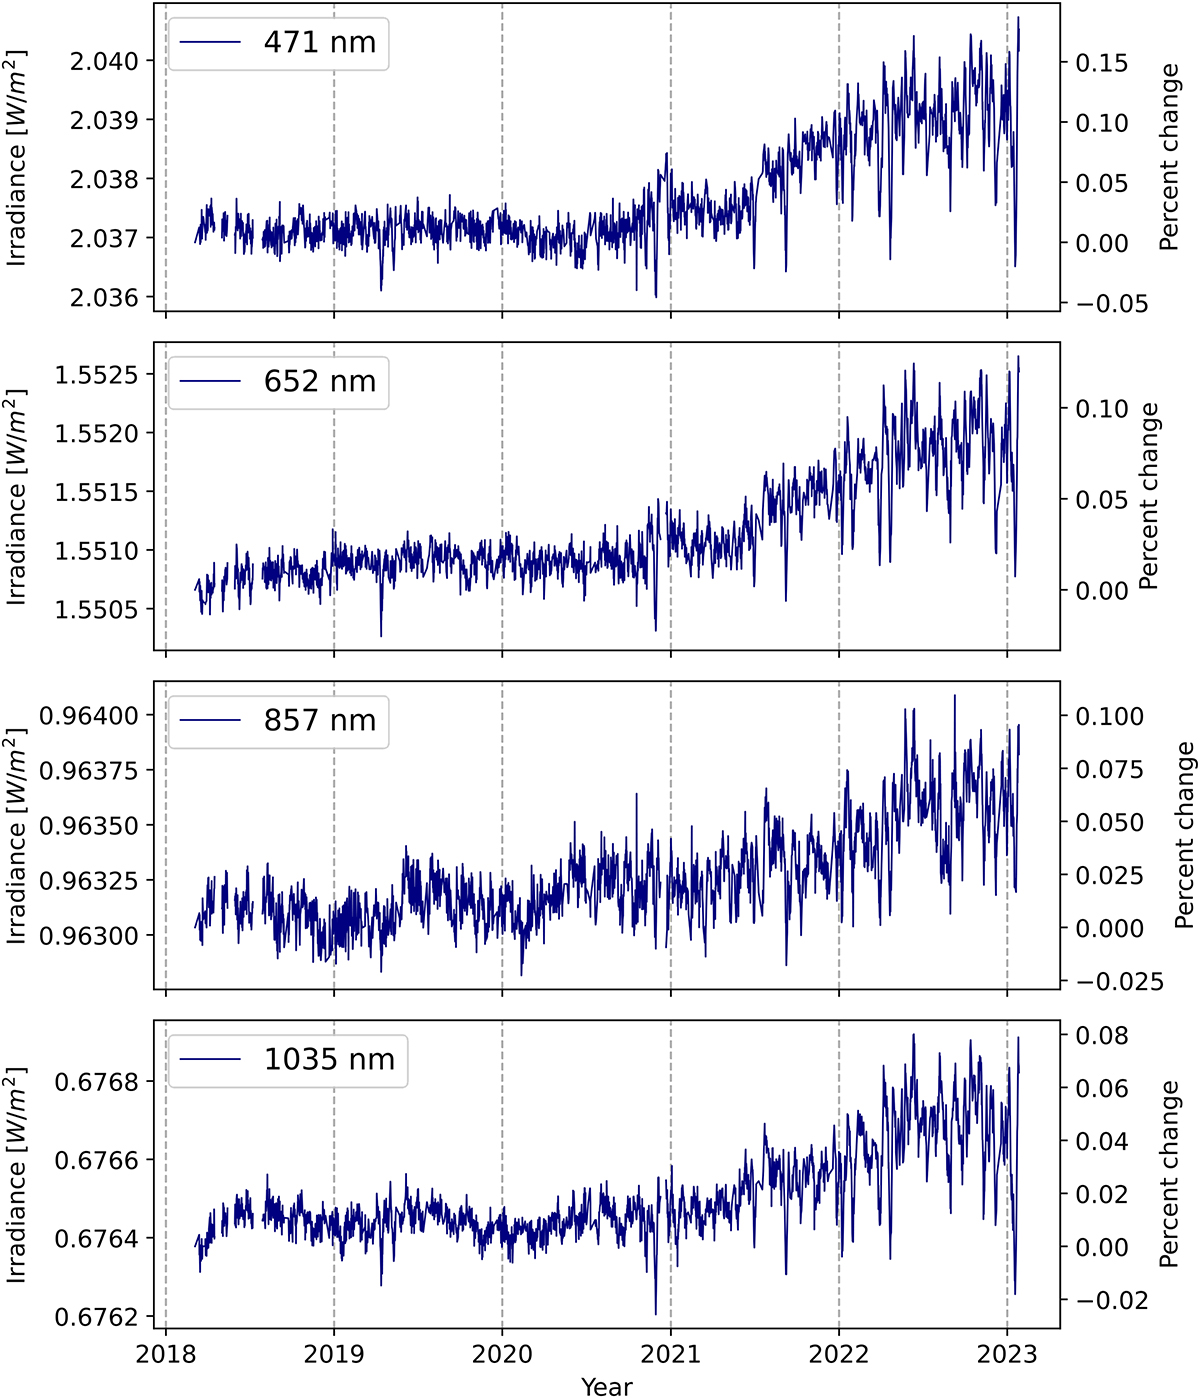
Figure 8

Download original image
The TSIS-1 SIM (V10) time series is shown at selected wavelengths in the visible and near IR, over the first 5 years of the mission. Left axis shows the absolute irradiance and the right axis shows the relative change (in %) from the first day of operations (March 14, 2018). Note the decrease in the relative variability in the ascending phase of SC25. Also, note that all wavelengths are in phase with the TSI, counter to the early findings of Harder et al. (2009) for previous cycles. The presence of a residual annual cycle in the longest wavelengths (at the 0.01% level) is instrumental in origin and discussed in the text.
Current usage metrics show cumulative count of Article Views (full-text article views including HTML views, PDF and ePub downloads, according to the available data) and Abstracts Views on Vision4Press platform.
Data correspond to usage on the plateform after 2015. The current usage metrics is available 48-96 hours after online publication and is updated daily on week days.
Initial download of the metrics may take a while.


