Figure 9

Download original image
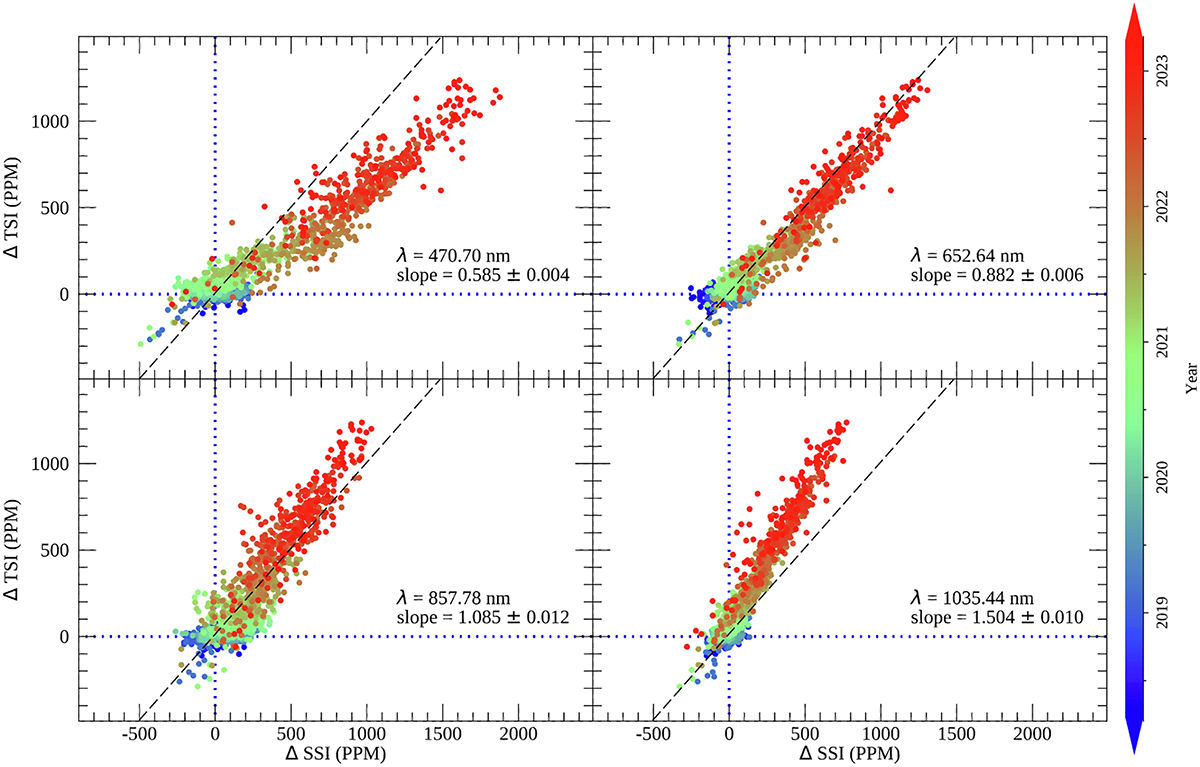
Correlations between TSIS-1 TIM TSI and SIM SSI variability during the ascending phase of SC25 for selected visible and near IR wavelengths: 471 nm, 653 nm, 858 nm, and 1035 nm. All cases show strong, positive (i.e., in-phase) correlations against the TSI. Blue dotted lines denote the solar minimum period in late 2019 and the black dashed lines represent the unity slope (1:1 variability). These results show that the SSI variability near 470 nm is ~70% greater than that of the TSI whereas at the longer wavelengths in the near IR (1035 nm), the SSI variability is ~30% less than the TSI variability.
Current usage metrics show cumulative count of Article Views (full-text article views including HTML views, PDF and ePub downloads, according to the available data) and Abstracts Views on Vision4Press platform.
Data correspond to usage on the plateform after 2015. The current usage metrics is available 48-96 hours after online publication and is updated daily on week days.
Initial download of the metrics may take a while.


