| Issue |
J. Space Weather Space Clim.
Volume 5, 2015
|
|
|---|---|---|
| Article Number | A1 | |
| Number of page(s) | 8 | |
| DOI | https://doi.org/10.1051/swsc/2015001 | |
| Published online | 03 February 2015 | |
Research Article
The DTM-2013 thermosphere model
CNES, Department of Terrestrial and Planetary Geodesy, 18 avenue E. Belin, 31401
Toulouse Cedex 4, France
* Corresponding author: This email address is being protected from spambots. You need JavaScript enabled to view it.
Received:
8
October
2014
Accepted:
27
December
2014
Abstract
Aims – The Drag Temperature Model (DTM) is a semi-empirical model describing the temperature, density, and composition of the Earth’s thermosphere. DTM2013 was developed in the framework of the Advanced Thermosphere Modelling and Orbit Prediction project (ATMOP). It is evaluated and compared with DTM2009, the pre-ATMOP benchmark, and the Committe on Space Research (COSPAR) reference model for atmospheric drag JB2008.
Methods – The total density data used in this study, including the high-resolution CHAMP, GRACE and GOCE data, cover the 200–900 km altitude range and all solar activities. DTM2013 was constructed with the data assimilated in DTM2009, but with more GRACE data, and low-altitude GOCE data in particular. The solar activity proxy, F10.7 in DTM2009, has been replaced with F30. The bias and precision of the models is evaluated by comparing to the observations according to a metric, which consists of computing mean, RMS, and correlation. Secondly, the residuals are binned, which procedure aids in revealing specific model errors.
Results – This evaluation shows that DTM2013 is the least biased and most precise model for the data that were assimilated. Comparison to independent density data shows that it is also the most accurate model overall. It is a significant improvement over DTM2009 under all conditions and at all altitudes, but the largest improvements are obtained at low altitude thanks to GOCE data. The precision of JB2008 decreases with altitude, which is due to its modeling of variations in local solar time and seasons in particular of the exospheric temperature rather than modeling these variations for the individual constituents.
Key words: Density modeling / Temperature modeling / Satellite drag / Orbit determination
© S. Bruinsma, Published by EDP Sciences 2015
 This is an Open Access article distributed under the terms of the Creative Commons Attribution License (http://creativecommons.org/licenses/by/4.0), which permits unrestricted use, distribution, and reproduction in any medium, provided the original work is properly cited.
1. Introduction
Atmospheric density models are, besides their use in atmospheric studies, required in the computation of the atmospheric drag force in satellite orbit determination and prediction. They predict instantaneous temperature and (partial) density as a function of the location (altitude, latitude, longitude, local solar time), solar and geomagnetic activities, and day-of-year.
The thermosphere model DTM2013 (Drag Temperature Model) was developed in the framework of the Advanced Thermosphere Modelling and Orbit Prediction project (ATMOP; http://www.atmop.eu), which was a European Union 7th Framework project. The main objective of the ATMOP research project was to update the DTM2009 thermosphere model (Bruinsma et al. 2012) and to develop an operational version. A full description of the project is given in the Science Document, which is available on the ATMOP website. DTM2013 is evaluated by comparisons to total density data and the pre-ATMOP benchmark DTM2009 (Bruinsma et al. 2012) in order to demonstrate and quantify the improvements made. Although not the main topic of this paper, results for the COSPAR reference model for atmospheric drag JB2008 (Bowman et al. 2008) are also given in most cases.
Specifically, model bias and precision will be given globally, and as a function of latitude, local solar time, season, and solar activity when this is informative of model flaws or strengths. Such detailed evaluations can be performed only relatively recently thanks to the high-resolution total density data inferred from CHAMP (Bruinsma et al. 2004), GRACE (Bruinsma & Forbes 2010), and GOCE (Bruinsma et al. 2014) accelerometer measurements, which have covered more than a solar cycle now. Still, these density datasets only allow fine analysis of the latitudinal structure on a per orbit (about 95 min) basis, and from pole to pole. However, the density database is augmented for completeness with total densities inferred from:
-
Stella and Starlette precise orbit determination;
-
Densities inferred from energy dissipation rates (EDR densities).
These densities are low-resolution observations, averaged over one day or longer, but their spatial and solar cycle coverage is good. Bruce Bowman has kindly made the EDR data available as additional validation data in the 200–500 km altitude range.
The models evaluated in this paper are constructed by fitting to the underlying density database as good as possible in the least-squares sense (i.e. semi-empirical model). They represent mean climatology models of the thermosphere. The spatial resolution of such models is of the order of thousands of kilometers. Consequently, density variations at smaller scales are sources of geophysical noise (e.g. gravity waves, upward propagating tides; Bruinsma & Forbes 2008). The solar- and geomagnetic indices, besides being proxies, limit the temporal resolution of these models to 1 day and 1–3 h, respectively. Therefore, small-scale and high-frequency density perturbations, which are primarily present at high latitudes, cannot be modeled either and contribute to the prediction uncertainty.
The next section summarily reviews the data used in this study and the model algorithm. The test results are presented in Section 3 and discussed in Section 4. Note that a specific analysis under geomagnetic storm conditions has not been done in the present study because new geomagnetic indices were not developed within ATMOP, and the model DTM2013 still uses the planetary index am.
2. Data and model description
2.1. The total density data
Essentially the same neutral density data that were used in the benchmark model DTM2009 and described in Bruinsma et al. (2012) are used in the construction and validation of DTM2013, with some notable exceptions. Only these new datasets will be described in more detail, as well as the only independent dataset. The two-line element dataset is not used anymore because of its low accuracy (20–30%), and the Deimos-1 data are not used because of its too short duration (2010–2011). All datasets assimilated in DTM2013 are listed in Table 1.
Data used in the construction of DTM2013.
2.1.1. Total density inferred from accelerometer measurements on GOCE
GOCE (Gravity field and steady-state Ocean Circulation Explorer; ESA, 1999), the first of ESA’s Earth Explorer missions, was launched in March 2009 in a 96.5° inclination, dawn-dusk orbit, and reentered the atmosphere in November 2013. The Science Mission lasted from 1 November 2009 through 22 October 2013. The orbit was maintained at a constant 255 km mean altitude up to 1 July 2012, after which the spacecraft was lowered four times to enhance the gravity signal, ultimately to 224 km in May 2013. The ion thrusters that compensated for atmospheric drag continuously made this possible. GOCE neutral densities (and cross-track winds) are an official ESA product (https://earth.esa.int/web/guest/missions/goce/goce-thermospheric-data). They have a resolution of 80 km along the orbit with an accuracy of a few percent (Bruinsma et al. 2014). The accuracy was for the largest part established through comparison with densities from the High Accuracy Satellite Drag Model (HASDM; Storz et al. 2005), which model is corrected in near real time from observed drag effects. In this study we will use GOCE data scaled (with a factor of 1.25) to HASDM, as was done in the ESA Final Report (Doornbos et al. 2014), effectively assuming that HASDM is unbiased. This is not necessarily true; the scale of a model is closely related to the aerodynamic coefficients that were used in the derivation of atmospheric density, for which unfortunately neither a standard nor consensus is present. Not the entire dataset was assimilated in DTM2013, because at the time of its creation data was available up to May 2012. Therefore, GOCE data from June 2012 to October 2013 is for validation.
2.1.2. Daily total densities by means of the Energy Dissipation Rate (EDR) method
Daily-mean densities inferred from satellite drag data of 18 satellites in elliptical orbits, with perigee heights in the 200–500 km range, were kindly provided by Bruce Bowman for this evaluation. Latitude coverage is from pole to pole taking all objects into account, and most satellites cover more than the last solar cycle (1994–2010). The densities are computed from the estimated energy dissipation rates, which are derived from the orbits fitted directly to radar and optical tracking data. This method thus benefits from the true accuracy of the classified radar data. The uncertainty of the daily densities is estimated to be 2–4%. For a complete description of the method and the data we refer to Bowman et al. (2004).
2.2. The DTM2013 algorithm
The algorithm has not been modified with respect to the description given in Bruinsma et al. (2012). However, the 30 cm solar radio flux, F30 (described in detail Dudok de Wit et al. 2014), is presently used as solar proxy, whereas DTM2009 uses F10.7. The F30 proxy, measured in Japan (Nobeyama) since 1957, is more representative of the thermospheric solar energetic input in the ultraviolet than F10.7. Dudok de Wit et al. (2014) tested both F10.7 and F30 in DTM test models that were otherwise constructed identically with the same density datasets. The model driven by F30 reconstructed observed densities with higher fidelity, and the authors ascribed this to the five times higher contribution of thermal Bremsstrahlung that comes from plages and faculae in F30 compared with F10.7 (50% vs. 10%, respectively). Being a terrestrial measurement, it is more robust and more accurately calibrated than satellite measurements of solar emissions. For convenience and practical reasons, F30 is used after scaling to F10.7, so that both proxies can be used to drive the model. Figure 1 shows the different long-period (81-day average) evolution of F30 and F10.7 for 2000–2013, and the short-period variations for 2010–2012. The dataset of solar radio emissions (F30, F15, F10.7, F8, and F3.2 cm) is available for download from http://projects.pmodwrc.ch/solid/. The planetary geomagnetic index Km (based on the am index, which is described here: isgi.latmos.ipsl.fr/des_am.html) is used, as is the case of DTM2009, but Kp (based on the ap index) can also be used.
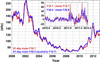 |
Figure 1. The 81-day mean observations of the solar activity proxies F30 and F10.7, and the daily minus mean flux for 2010–2012 (inset). |
The representation of the total density in the altitude range 120 to approximately 1500 km is achieved by summing the contributions of the main thermosphere constituents (N2, O2, O, He, H), under the hypothesis of independent static diffuse equilibrium. The total density ρ at altitude z is calculated as follows: (1)
(1)
Partial densities i are specified at 120 km altitude and propagated to higher altitudes employing the height function f(z), which is based on temperature. The exospheric temperature and the partial density variations as a function of the environmental parameters L (latitude, local solar time, solar flux, and geomagnetic activity) are modeled by means of a spherical harmonic function G(L). DTM2013 models the exospheric temperature and the atmospheric constituents each with up to 50 coefficients, which are estimated together with the concentrations at 120 km in a least-squares adjustment. The function G is used to model periodic (annual and semi-annual terms, diurnal, semidiurnal, and terdiurnal terms) and non-periodic variations (constant zonal latitude coefficients, and coefficients relating solar and geomagnetic activity to temperature and density).
2.3. Relevant information on data, DTM2009 and JB2008
DTM2009 employs F10.7 and the Km or Kp index to model temperature and major and minor constituents. JB2008 is constructed using a combination of solar- and geomagnetic proxies and indices, which were not all available before 1998, to reconstruct temperature and total density.
The GRACE densities were scaled to be consistent with the CHAMP densities (errors in the satellite macro model, e.g. cause scale effects). This was done by comparison of normalized densities (to the average altitude) for two periods (in 2003 and 2005) for which the orbits of both satellites were coplanar, and then scaling the GRACE to the CHAMP densities (Bruinsma & Forbes 2010). The scale factor applied to the GRACE densities is 1.23. The EDR densities are not scaled, and therefore offsets with the other datasets are to be expected. However, scaling of the GOCE densities to HASDM should lead to good consistency with the EDR densities (both originate at US Air Force Space Command).
A few years of CHAMP data were used in JB2008, but for storm-time modeling only. CHAMP, GRACE, GOCE, Starlette, and Stella data have been assimilated in DTM2013. The EDR densities were assimilated from 1997 to 2007 in JB2008.
3. Results
The models are evaluated by computing the mean and RMS of the density ratios, defined as “observed-to-calculated” (O/C). They correspond to the relative precision of the models; the absolute precision, i.e. in kg/m3, is difficult to interpret due to its orders of magnitude difference as a function of altitude. A model bias, i.e. the mean, is most damaging in orbit extrapolation because it causes position errors that increase with time. The RMS represents a combination of the ability of the model to reproduce the observed variations and the geophysical and instrumental noise in the observations. The correlation coefficients R are also computed. Contrary to RMS, they are insensitive to model bias and R2 represents the fraction of observed variance captured by the model. In the next section, the relative precisions of the models are evaluated on a yearly basis (i.e. the mean and RMS of the density ratios are computed as the average per calendar year).
The density ratios are also binned as a function of altitude, latitude, local time, month, and 81-day mean F10.7/F30. Analysis of the mean and RMS of the ratios may give clues about specific modeling errors, or about data inconsistencies. Specific results are presented in Section 3.2.
The density datasets may be inconsistent due to errors and approximations in the satellite macro models, in the drag coefficients, and surface-to-mass ratios used in their derivation. This will cause the model to be biased with respect to those datasets, but the least-squares adjustment provides the least-biased solution. This kind of inconsistency will disappear when a standard calculation for the drag force is adopted, which is not the topic of this paper, and all datasets reprocessed applying the standard.
3.1. Overall relative model precision
The mean and RMS of the density ratios are computed per year for GOCE, CHAMP, GRACE, Stella, and Starlette, and as the average of the EDR density ratios in the 200–400 km altitude range (13 satellites) and in the 400–500 km range (five satellites). Figures 2 and 3 show the mean and RMS of the density ratios per year for DTM2009, JB2008, and DTM2013, respectively. For JB2008, the comparisons start in 1999 due to the unavailability of its indices earlier. It is evident from these figures that DTM2013 is the least biased model and that variations are best reproduced over the solar cycle and in the altitude range 250–800 km covered by these datasets. It is a clear improvement over DTM2009, especially at the lowest (GOCE) and highest altitudes (Stella and Starlette), which was the objective of ATMOP. DTM2009 underestimates GOCE densities by about 10% (16% in 2013), whereas DTM2013 has negligible bias and an RMS of the density ratios that is at the 10% level for 2010–2013. Note that GOCE data in the interval June 2012 to October 2013 were not assimilated in DTM2013. For the only overlapping year of GOCE and EDR densities, 2010, the density ratios are nearly identical. The Stella and Starlette density ratios of DTM2009 are gradually decreasing from 1992 to 2009, and this is no longer the case of DTM2013. This hints at calibration issues most probably in F10.7, or in F30, or in both. The Starlette density ratio with DTM2013 in 1993 appears to be affected by errors in F30. JB2008 is most biased at all altitudes, and its performance for 2009–2013 is significantly worse than for 1999–2008 (i.e. the data assimilation period). The EDR data, not used in DTM but partially in JB2008, are reproduced with smaller bias (in particular during the solar minimum 2008–2009) and homogeneous RMS with the DTM models.
 |
Figure 2. The mean of the density ratios per year for DTM2009 (top), JB2008, and DTM2013 (bottom). |
 |
Figure 3. The RMS of the density ratios per year for DTM2009 (top), JB2008, and DTM2013 (bottom). |
A notable feature common to the three models is the dip in 2008–2009 during solar minimum, which can be explained by the very low solar UV emissions. The actual UV flux is overestimated with the F10.7 proxy during the last solar minimum, and consequently models overestimate density (Solomon et al. 2010, 2011). Since this effect is also seen DTM2013, F30 apparently also overestimated the UV flux during the last minimum, but less. The models also have large biases in 2010–2011 for CHAMP and GRACE (densities are underestimated). The EDR densities for both altitude ranges have a similar jump in the density ratio from 2009 to 2010, even if their biases are not as big in 2010. The effect is largest for JB2008 and smallest for DTM2013, which suggests that the solar proxies are the cause, but this time they seem to underestimate UV flux. F10.7 and F30 are rather different for 2010–2011 (Fig. 1) and consistent with the observed density ratios, i.e. F30 is larger than F10.7.
The correlation coefficients for the complete datasets are listed in Table 2. They are equal to or larger than 0.93 for all datasets with DTM2013. The low correlations of JB2008 with the Stella and Starlette data are due to its model algorithm, which does not calculate density as a sum of constituents. Helium mainly sits in the winter hemisphere, the so-called winter Helium bulge (Keating & Prior 1968), but JB2008 predicts density maxima always in the summer hemisphere. The erroneous latitude structure causes the correlations to be small.
Correlation coefficients of the models with complete datasets (i.e. all years).
3.2. Specific comparisons (binning)
Binning the density ratios in the model input parameters is a test of model quality with respect to specific variations. In the next sections, the most relevant and revealing comparisons are shown. Note that binning gives basic information on modeling errors because sorting data in specific bins only partly averages out model errors with different origins.
3.2.1. Latitude bins
Figure 4 shows the CHAMP and GRACE density ratios in 20° latitude bins, per year, for DTM2009 and DTM2013. Both models have small biases for most years (most profiles lie within the ±5% interval indicated by the dashed lines), without apparent latitudinal structure. The biases in 2010–2011 are large, but significantly smaller with DTM2013. The solar minimum year 2008 with CHAMP is also less biased with DTM2013, whereas the first year of GRACE (2003) is more biased. Overall, improvement is made. DTM2009 already was less biased than JB2008, as can be seen in Figure 6 of Bruinsma et al. (2012)
 |
Figure 4. The bias of the CHAMP (left) and GRACE (right) density ratios in latitude bins per year for DTM2009 (top) and DTM2013 (bottom), in percent. |
Figure 5 presents the density ratios in 20° latitude bins, but now for the complete datasets (i.e. CHAMP from 2001 to 2010, etc.) of DTM2009, DTM2013, and JB2008. The scale is the same for the DTM models, but larger for JB2008. DTM2013 biases are less than 5% for all datasets, i.e. at all altitudes. The improvement over DTM2009 is particularly clear for Starlette and Stella, and GRACE. JB2008 has large latitude-related errors for Starlette and Stella, as well as for GOCE.
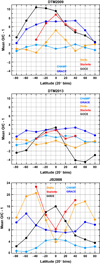 |
Figure 5. Density ratios binned in latitude of DTM2009 (top), DTM2013 (middle), and JB2008 (bottom). |
3.2.2. Local time bins
Figure 6 presents the density ratios in 2-h local solar time bins of CHAMP, GRACE, and Starlette for DTM2009, DTM2013, and JB2008. GOCE and Stella are not displayed because they are in (near) Sun synchronous orbits and therefore not helpful. The scale is the same again for the DTM models, and larger again for JB2008. All models fail to accurately reproduce Starlette, but DTM2013 comes closest; DTM2009 presents a semidiurnal residue, whereas the JB2008 error is strongly diurnal. The GRACE error with JB2008 is clearly semidiurnal.
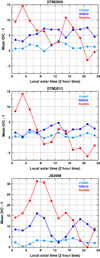 |
Figure 6. Density ratios binned in local solar time of DTM2009 (top), DTM2013 (middle), and JB2008 (bottom). |
3.2.3. Day-of-year bins
The data are binned in day-of-year (1-365/366) per 10 days in Figure 7, for DTM2009 and DTM2013. A seasonal error is not visible in the DTM2009 density ratios, or in DTM2013; however, all datasets seem to follow a similar variation in the second half of the year for the latter, in particular for days 270–370. The cause of such a 90-day variation is unknown. The DTM2013 density ratios remain well within the ±10% bias interval when all years are averaged. Figure 8 displays the CHAMP density ratios in day-of-year bins, but this time per year, in order to show an example of the increased errors when analyzing 10-day intervals directly. The fat black line is the all-year average, i.e. the same as in Figure 7.
 |
Figure 7. Density ratios binned in Day-of-year of DTM2009 (top) and DTM2013 (bottom). |
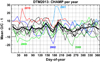 |
Figure 8. CHAMP density ratios binned in Day-of-year of DTM2013, per year. |
3.2.4. 81-day mean solar flux bins
Figure 9 presents the density ratios in 81-day mean solar radio flux bins. The last bin of DTM2013 is 230–240 sfu due to the use of F30 (scaled to F10.7) instead of F10.7, while for DTM2009 and JB2008 it is 220–230 sfu. DTM2013 is overestimating density at low altitude (GOCE and CHAMP) for minimum solar cycle conditions; for high solar activity (larger than 190 sfu) the model is less accurate too. JB2008 is not handling the low activity data (less than about 100 sfu) well at any altitude; note that the density ratio scale is much larger. Binning in mean solar flux bins does not give unambiguous results because it is a mix of solar activity and seasonal effects. Especially for the highest and lowest solar activity the density ratios are often taken in a single year.
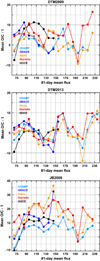 |
Figure 9. Density ratios binned in 81-day mean solar radio flux of DTM2009 (top), DTM2013 (middle), and JB2008 (bottom). |
4. Summary and conclusions
The latest version of DTM, DTM-2013, has been constructed using CHAMP, GRACE, and GOCE accelerometer-inferred densities and daily-mean density data, besides the historical data already assimilated in DTM-2000 (mass spectrometers in particular; Bruinsma et al. 2003). The solar and geomagnetic indices are used as the classical combination of the 81-day mean and 1-day delayed solar radio flux, but now of F30 converted to F10.7 scale, and the semi-logarithmic Km (based on am) or Kp (based on ap) planetary index. Using F30 instead of F10.7 has improved the modeling performance during the minimum solar activity years 2008–2009, although density is still being overestimated, as well as the transition to the years 2010–2011. The model density is also not drifting anymore in the interval 1992–2011 with respect to Stella, Starlette, and the EDR densities (Fig. 2).
DTM2013 is the most precise for the datasets that were assimilated. For CHAMP, GRACE, and GOCE it performs significantly better than DTM2009 and JB2008. For the higher altitude Starlette and Stella data, DTM2013 performs significantly better too than DTM2009, notably before 2000. The external EDR data in both the 200–400 km and 400–500 km altitude intervals is equally more accurately reproduced with DTM2013 (the bias is 1% larger, but the RMS of the density ratios is smaller). JB2008 models the EDR densities more accurately than DTM2013 for the solar maximum years 1999–2002, but after that its accuracy decreases progressively over time.
Taking all of the above into account, DTM2013 is the most accurate model overall and a significant improvement over DTM2009 under all conditions. It is more accurate than JB2008 at all altitudes. Model improvements are still necessary, in particular below 300 km and above about 800 km, for which the complete density database is still rather sparse. New high-resolution data are however not foreseen in the immediate future, and certainly not above 800 km. Secondly, it is essential that the density datasets available at present are reprocessed according to a to- be- developed standard in order to make them consistent. That will already improve the model accuracy, because the adjustment of the model coefficients will then become more precise.
Acknowledgments
This study received funding from the European Community’s Seventh Framework Programme (FP7‐SPACE‐2010‐1) under the Grant Agreement No. 261948 (ATMOP project, http://www.atmop.eu). Part of this work was performed in the framework of ESA’s Support to Science Element (STSE) study “GOCE+ Air density and wind retrieval using GOCE data”. SLB is equally supported by CNES/TOSCA. The editor thanks two anonymous reviewers for their assistance in evaluating this paper.
References
- Bowman, B.R., W.K. Tobiska, F. Marcos, C.Y. Huang, C.S. Lin, and W.J. Burke. A new empirical thermospheric density model JB2008 using new solar and geomagnetic indices, AIAA 2008-6438 AIAA/AAS Astrodynamics Specialist Conference, Honolulu, Hawaii, 2008. [Google Scholar]
- Bowman, B.R., F.A. Marcos, and M.J. Kendra. A method for computing accurate daily atmospheric density values from satellite drag data, AAS 04-173, 14th AAS/AIAA Space Flight Mechanics Conference, Maui, Hawaii, 2004. [Google Scholar]
- Bruinsma, S.L., E. Doornbos, and B.R. Bowman. Validation of GOCE densities and thermosphere model evaluation, Adv. Space Res., 54, 576–585, 2014, DOI: 10.1016/j.asr.2014.04.008. [Google Scholar]
- Bruinsma, S.L., N. Sánchez-Ortiz, E. Olmedo, and N. Guijarro. Evaluation of the DTM-2009 thermosphere model for benchmarking purposes, J. Space Weather Space Clim., 2, A04, 2012, DOI: 10.1051/swsc/2012005. [CrossRef] [EDP Sciences] [Google Scholar]
- Bruinsma, S.L., and J.M. Forbes. Anomalous behavior of the thermosphere during solar minimum observed by CHAMP and GRACE, J. Geophys. Res., 115, A11323, 2010, DOI: 10.1029/2010JA015605. [CrossRef] [Google Scholar]
- Bruinsma, S.L., and J.M. Forbes. Medium to large-scale density variability as observed by CHAMP, Space Weather, 6, S08002, 2008, DOI: 10.1029/2008SW000411. [CrossRef] [Google Scholar]
- Bruinsma, S., D. Tamagnan, and R. Biancale. Atmospheric densities derived from CHAMP/STAR accelerometer observations, Planet. Space Sci., 52, 297–312, 2004. [Google Scholar]
- Bruinsma, S., G. Thuillier, and F. Barlier. The DTM-2000 empirical thermosphere model with new data assimilation and constraints, J. Atmos. Sol-Terr. Phys., 65, 1053–1070, 2003. [Google Scholar]
- Doornbos, E., S. Bruinsma, B. Fritsche, G. Koppenwallner, P. Visser, J. Van Den IJssel, and J. de Teixeira de Encarnação. ESA contract 4000102847/NL/EL, GOCE+ Theme 3: Air density and wind retrieval using GOCE data – Final Report, TU Delft, 2014. [Google Scholar]
- Dudok de Wit, T., S. Bruinsma, and K. Shibasaki. Synoptic radio observations as proxies for upper atmosphere modelling, J. Space Weather Space Clim., 4, A06, 2014, DOI: 10.1051/swsc/2014003. [CrossRef] [EDP Sciences] [Google Scholar]
- ESA. Report SP-1233(1) – The Four Candidate Earth Explorer Core Missions - Gravity field and steady-state ocean circulation explorer European Space Agency, 1999. [Google Scholar]
- Keating, G.M., and E.J. Prior. The winter helium bulge, Space Res., 8, 982–992, 1968. [Google Scholar]
- Solomon, S.C., L. Qian, L.V. Didkovsky, R.A. Viereck, and T.N. Woods. Causes of low thermospheric density during the 2007–2009 solar minimum, J. Geophys. Res., 116, 2011, DOI: 10.1029/2011JA016508. [Google Scholar]
- Solomon, S.C., T.N. Woods, L.V. Didkovsky, J.T Emmert, and L. Qian. Anomalously low solar extreme-ultraviolet irradiance and thermospheric density during solar minimum, Geophys. Res. Lett., 37, 2010, DOI: 10.1029/2010GL044468. [Google Scholar]
- Storz, M.F., B.R. Bowman, M.J.I. Branson, S.J. Casali, and W.K. Tobiska. High accuracy satellite drag model (HASDM), Adv. Space Res., 36, 2497–2505, 2005, DOI: 10.1016/j.asr.2004.02.020. [Google Scholar]
Cite this article as: Bruinsma S. The DTM-2013 thermosphere model. J. Space Weather Space Clim., 5, A1, 2015, DOI: 10.1051/swsc/2015001.
All Tables
All Figures
|
Figure 1. The 81-day mean observations of the solar activity proxies F30 and F10.7, and the daily minus mean flux for 2010–2012 (inset). |
| In the text | |
|
Figure 2. The mean of the density ratios per year for DTM2009 (top), JB2008, and DTM2013 (bottom). |
| In the text | |
|
Figure 3. The RMS of the density ratios per year for DTM2009 (top), JB2008, and DTM2013 (bottom). |
| In the text | |
|
Figure 4. The bias of the CHAMP (left) and GRACE (right) density ratios in latitude bins per year for DTM2009 (top) and DTM2013 (bottom), in percent. |
| In the text | |
|
Figure 5. Density ratios binned in latitude of DTM2009 (top), DTM2013 (middle), and JB2008 (bottom). |
| In the text | |
|
Figure 6. Density ratios binned in local solar time of DTM2009 (top), DTM2013 (middle), and JB2008 (bottom). |
| In the text | |
|
Figure 7. Density ratios binned in Day-of-year of DTM2009 (top) and DTM2013 (bottom). |
| In the text | |
|
Figure 8. CHAMP density ratios binned in Day-of-year of DTM2013, per year. |
| In the text | |
|
Figure 9. Density ratios binned in 81-day mean solar radio flux of DTM2009 (top), DTM2013 (middle), and JB2008 (bottom). |
| In the text | |
Current usage metrics show cumulative count of Article Views (full-text article views including HTML views, PDF and ePub downloads, according to the available data) and Abstracts Views on Vision4Press platform.
Data correspond to usage on the plateform after 2015. The current usage metrics is available 48-96 hours after online publication and is updated daily on week days.
Initial download of the metrics may take a while.