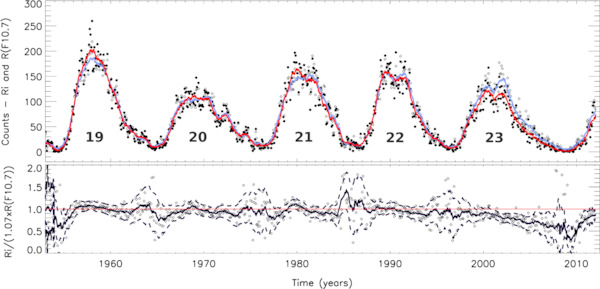
Fig. 1

Download original image
Comparison of Ri and the F10.7 proxy for Ri over the last 60 years (Johnson 2010). Top panel: plots of the monthly Ri and F10.7 values (black and white dots respectively) and of the 1-year smoothed Ri and F10.7 values (red and blue curves respectively). The cycle numbers are indicated. Bottom panel: monthly ratios Ri/F10.7 (diamonds) and the 1-year smoothed ratio (solid line) with the 3σ confidence levels (dashed lines). It shows the overall agreement between the indices until the year 2000 and the significant discrepancy appearing after 2000.
Current usage metrics show cumulative count of Article Views (full-text article views including HTML views, PDF and ePub downloads, according to the available data) and Abstracts Views on Vision4Press platform.
Data correspond to usage on the plateform after 2015. The current usage metrics is available 48-96 hours after online publication and is updated daily on week days.
Initial download of the metrics may take a while.


