Fig. 3

Download original image
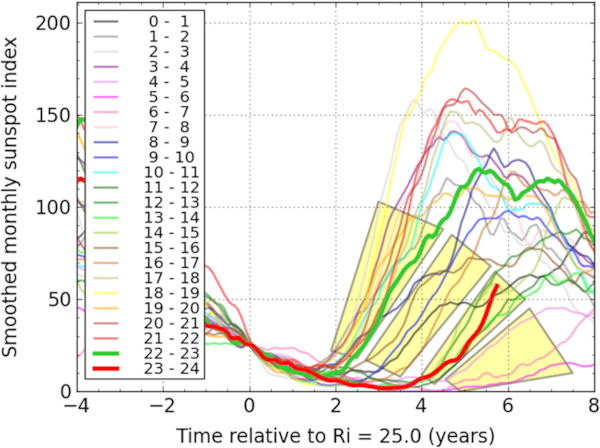
Superposed-epoch plot of the Ri index obtained by aligning all solar cycles 0–23 on their Ri = 25 crossing point in the final decaying phase of the cycle (NB: Curves are numbered according to the cycles preceding and following the minimum). This representation allows us to compare directly the length and depth of the solar minima. Thick lines highlight the 22–23 minimum (green) and the last minimum 23–24 (red). The four shaded boxes mark four families of cycles according to the steepness of the rise following the minimum: fast, moderate, late and weak (top to bottom).
Current usage metrics show cumulative count of Article Views (full-text article views including HTML views, PDF and ePub downloads, according to the available data) and Abstracts Views on Vision4Press platform.
Data correspond to usage on the plateform after 2015. The current usage metrics is available 48-96 hours after online publication and is updated daily on week days.
Initial download of the metrics may take a while.


