Open Access
Fig. 1.
Download original image
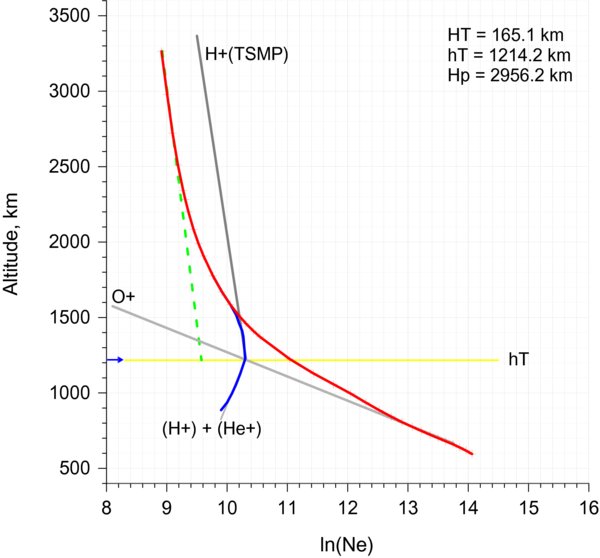
One measured Ne profile (red curve), the inferred O+ distribution (light gray line), the transition height (yellow line), and the H+ distribution above transition height (green dashed line). The TSMP H+ distribution is plotted with the dark gray line. The blue curve represents the expected light-ion (H+ + He+) distribution.
Current usage metrics show cumulative count of Article Views (full-text article views including HTML views, PDF and ePub downloads, according to the available data) and Abstracts Views on Vision4Press platform.
Data correspond to usage on the plateform after 2015. The current usage metrics is available 48-96 hours after online publication and is updated daily on week days.
Initial download of the metrics may take a while.