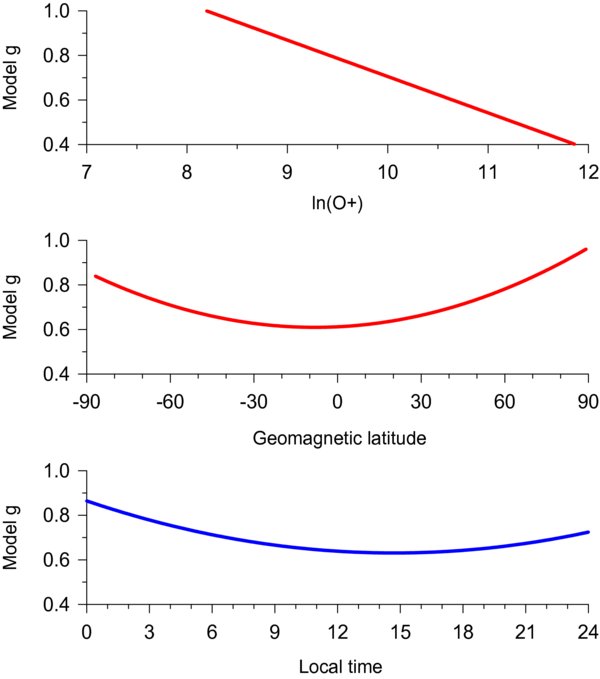
Fig. 5.
Download original image
The projection of the function gm on each of the axes plane approximated with low order polynomials; top panel: the linear fit shows that gm have a tendency to decrease with increasing O+ density; middle panel: gm has a minimum of around 0.6 at low latitudes and increases toward higher latitudes; bottom panel: local time dependence shows a minimum in the early afternoon hours.
Current usage metrics show cumulative count of Article Views (full-text article views including HTML views, PDF and ePub downloads, according to the available data) and Abstracts Views on Vision4Press platform.
Data correspond to usage on the plateform after 2015. The current usage metrics is available 48-96 hours after online publication and is updated daily on week days.
Initial download of the metrics may take a while.