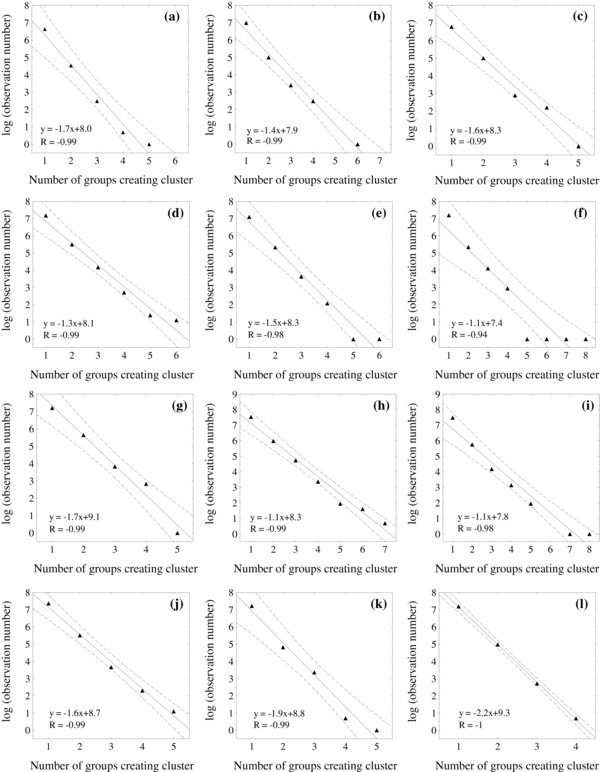
Fig. 5.
Download original image
(a) The fit of a regression line (solid line) with the 95% confidence bands (dashed lines) to the histogram points of number of sunspot groups creating one cluster from the northern hemisphere in the log-linear scale plot for (a) cycle 12, (b) cycle 13, (c) cycle 14. (d–f) The same as in the upper row, but for cycles 15–17. (g–i) The same as in the upper row, but for cycles 18–20. (j–l) The same as in the upper row, but for cycles 21–23. The correlation coefficients and the regression equations are presented in the left lower corners.
Current usage metrics show cumulative count of Article Views (full-text article views including HTML views, PDF and ePub downloads, according to the available data) and Abstracts Views on Vision4Press platform.
Data correspond to usage on the plateform after 2015. The current usage metrics is available 48-96 hours after online publication and is updated daily on week days.
Initial download of the metrics may take a while.