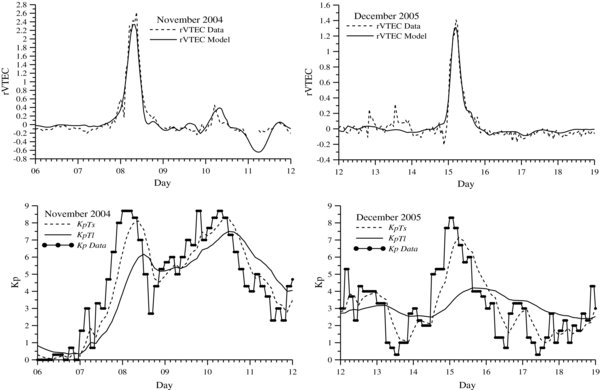
Fig. 14.
Download original image
(Upper row of plots) Comparison between the observed (dashed line) and model (solid line) rVTEC at the geographic point (20° N, 130° W) for the geomagnetic storm in November 2004 (left plot and December 2005 (right plot); (bottom row of plots) Comparison between the measured Kp-index (tick solid line with dots) and modified KpTs – (dashed line) and KpTl – (solid line) indices for November 2004 (left plot) and December 2005 (right plot) (Andonov et al. 2011).
Current usage metrics show cumulative count of Article Views (full-text article views including HTML views, PDF and ePub downloads, according to the available data) and Abstracts Views on Vision4Press platform.
Data correspond to usage on the plateform after 2015. The current usage metrics is available 48-96 hours after online publication and is updated daily on week days.
Initial download of the metrics may take a while.