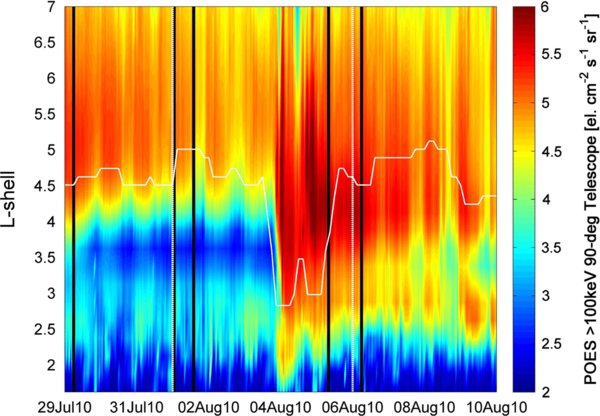
Fig. 8.

Download original image
POES (NOAA-17 to 19 and MetOp02) Space Environment Monitor (SEM-2) >100 keV quasi-trapped electron fluxes over 29 Jul–10 Aug, 2001. Vertical white dotted lines denote the study interval of interest. The white line shows the calculated position of plasmapause based on 12 h maximum K p index value (Moldwin et al. 2002).
Current usage metrics show cumulative count of Article Views (full-text article views including HTML views, PDF and ePub downloads, according to the available data) and Abstracts Views on Vision4Press platform.
Data correspond to usage on the plateform after 2015. The current usage metrics is available 48-96 hours after online publication and is updated daily on week days.
Initial download of the metrics may take a while.


